TryHackMe: Advent Of Cyber 2025 Day 15 (Web Attack Forensics - Drone Alone)

Explore web attack forensics using Splunk.
The Story

Introduction
TBFC’s drone scheduler web UI is getting strange, long HTTP requests containing Base64 chunks. Splunk raises an alert: “Apache spawned an unusual process.” On some endpoints, these requests cause the web server to execute shell code, which is obfuscated and hidden within the Base64 payloads. For this room, your job as the Blue Teamer is to triage the incident, identify compromised hosts, extract and decode the payloads and determine the scope.
You’ll use Splunk to pivot between web (Apache) logs and host-level (Sysmon) telemetry.
Follow the investigation steps below; each corresponds to a Splunk query and investigation goal.
Logging into Splunk
After you have started the AttackBox and the target machine in the previous task, allow the system around 3 minutes to fully boot, then use Firefox on the AttackBox to access the Splunk dashboard at http://MACHINE_IP:8000 using the credentials below.

The Splunk login page should look similar to the screenshot shown below.
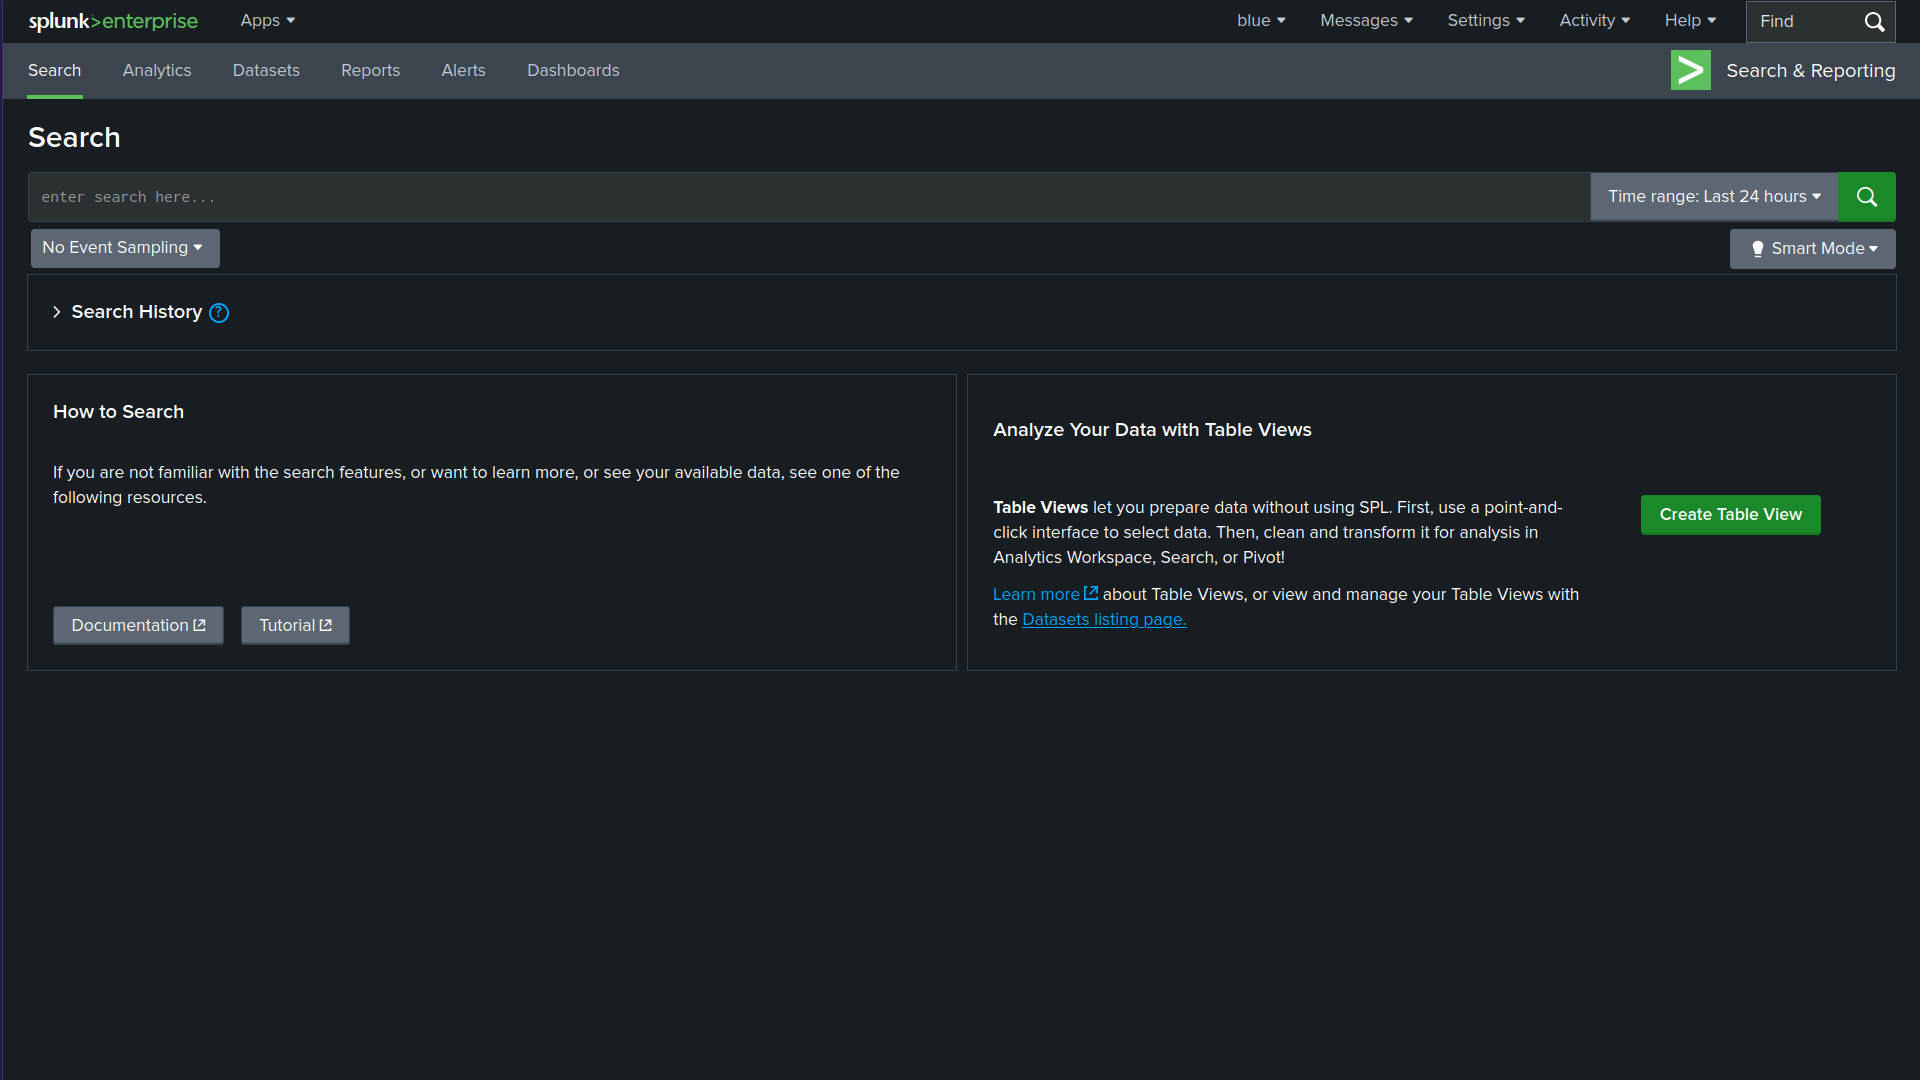
After logging in successfully, you will be taken to the Search Page as shown in the screenshot below.
Make sure to adjust the Splunk time range to include the time of the events (e.g., “Last 7 days” or “All time”). If the default range is too narrow, you may see “No results found.”
A Blue Teamer would explore various attack angles via Splunk. In this task, we will follow elf Log McBlue, who uses his Splunk magic to unravel the attack path.
Detect Suspicious Web Commands
In the first step, let’s search for HTTP requests that might show malicious activity. The query below searches the web access logs for any HTTP requests that include signs of command execution attempts, such as cmd.exe, PowerShell, or Invoke-Expression. This query helps identify possible Command Injection attacks, where the evil attacker tries to execute system commands through a vulnerable CGI script (hello.bat).
index=windows_apache_access (cmd.exe OR powershell OR "powershell.exe" OR "Invoke-Expression") | table _time host clientip uri_path uri_query status
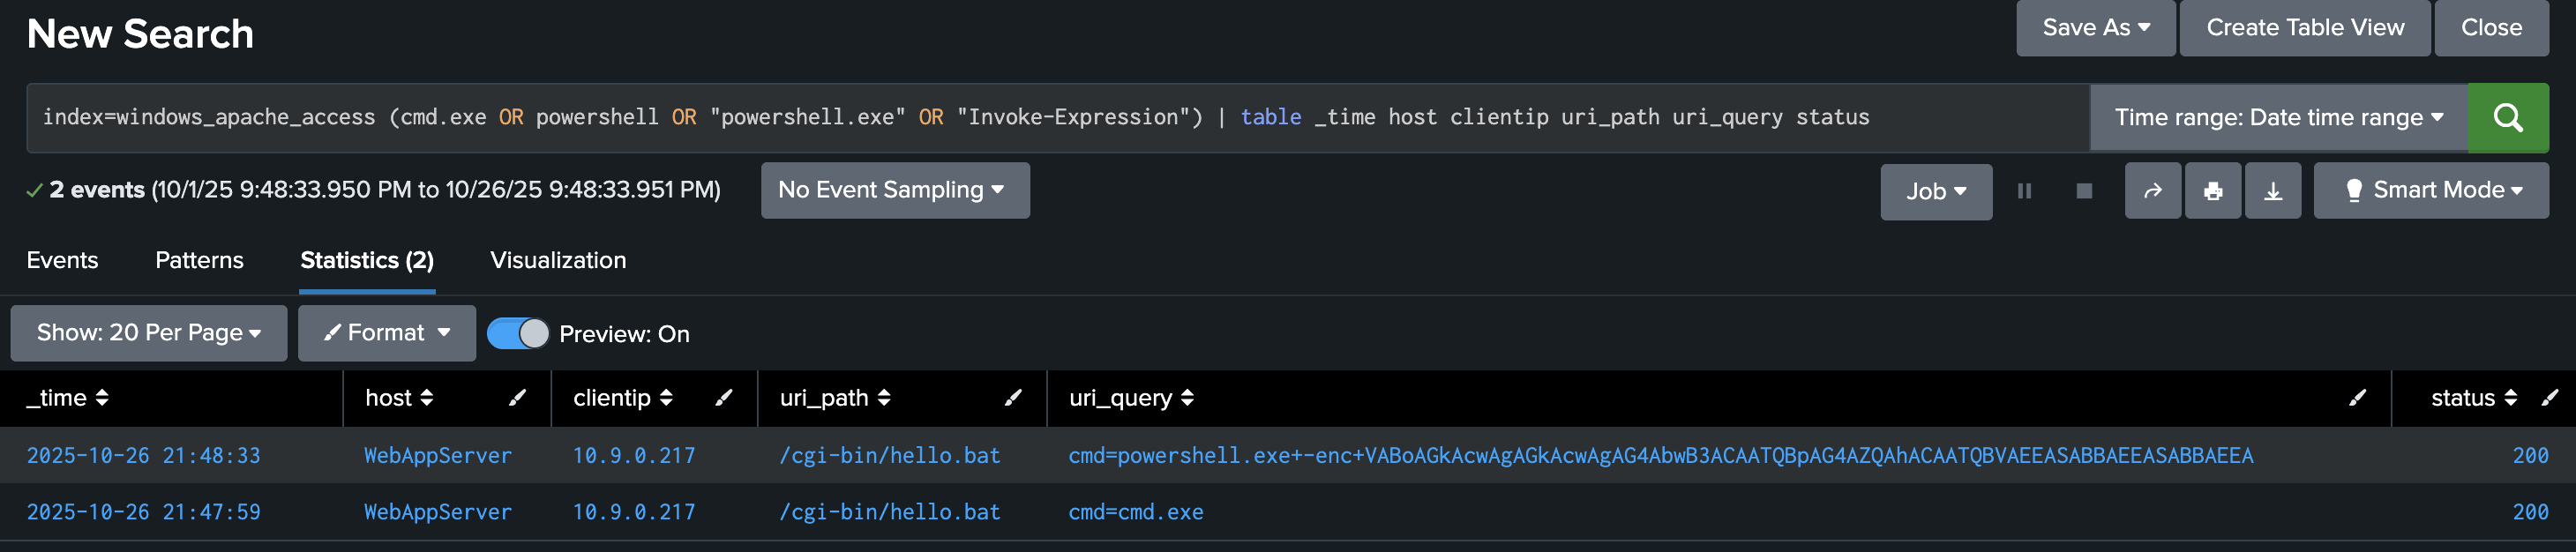
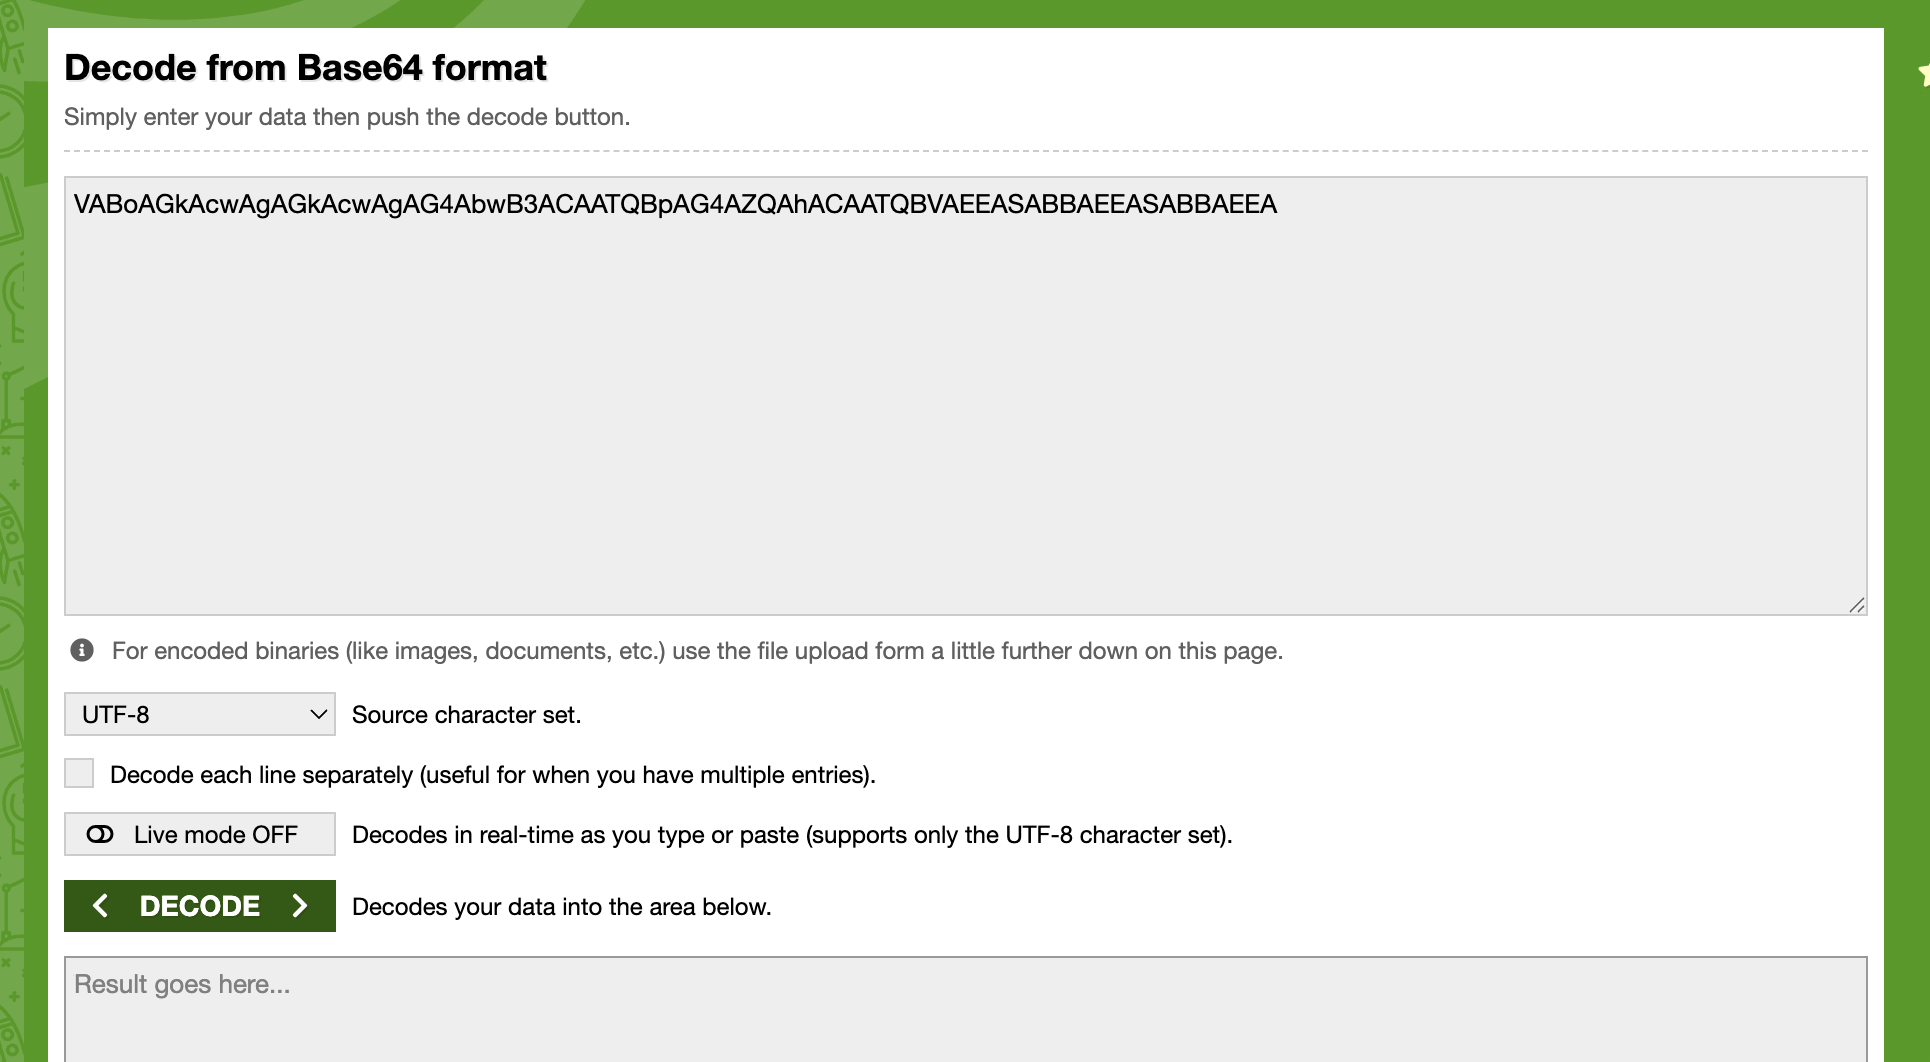
At this step, we are primarily interested in base64-encoded strings, which may reveal various types of activities. Once you spot encoded PowerShell commands, decode them using base64decode.org or your favourite base64 decoder to understand what the attacker was trying to do. Based on the results we received, let’s copy the encoded PowerShell string VABoAGkAcwAgAGkAcwAgAG4AbwB3ACAATQBpAG4AZQAhACAATQBVAEEASABBAEEASABBAEEA and paste it into https://www.base64decode.org/ upper field, then click on decode as shown in the screenshot below.
Looking for Server-Side Errors or Command Execution in Apache Error Logs
In this stage, we will focus on inspecting web server error logs, as this would help us uncover any malicious activity. We will use the following query:
index=windows_apache_error ("cmd.exe" OR "powershell" OR "Internal Server Error")
Please make sure you select View: Raw from the dropdown menu above the Event display field.
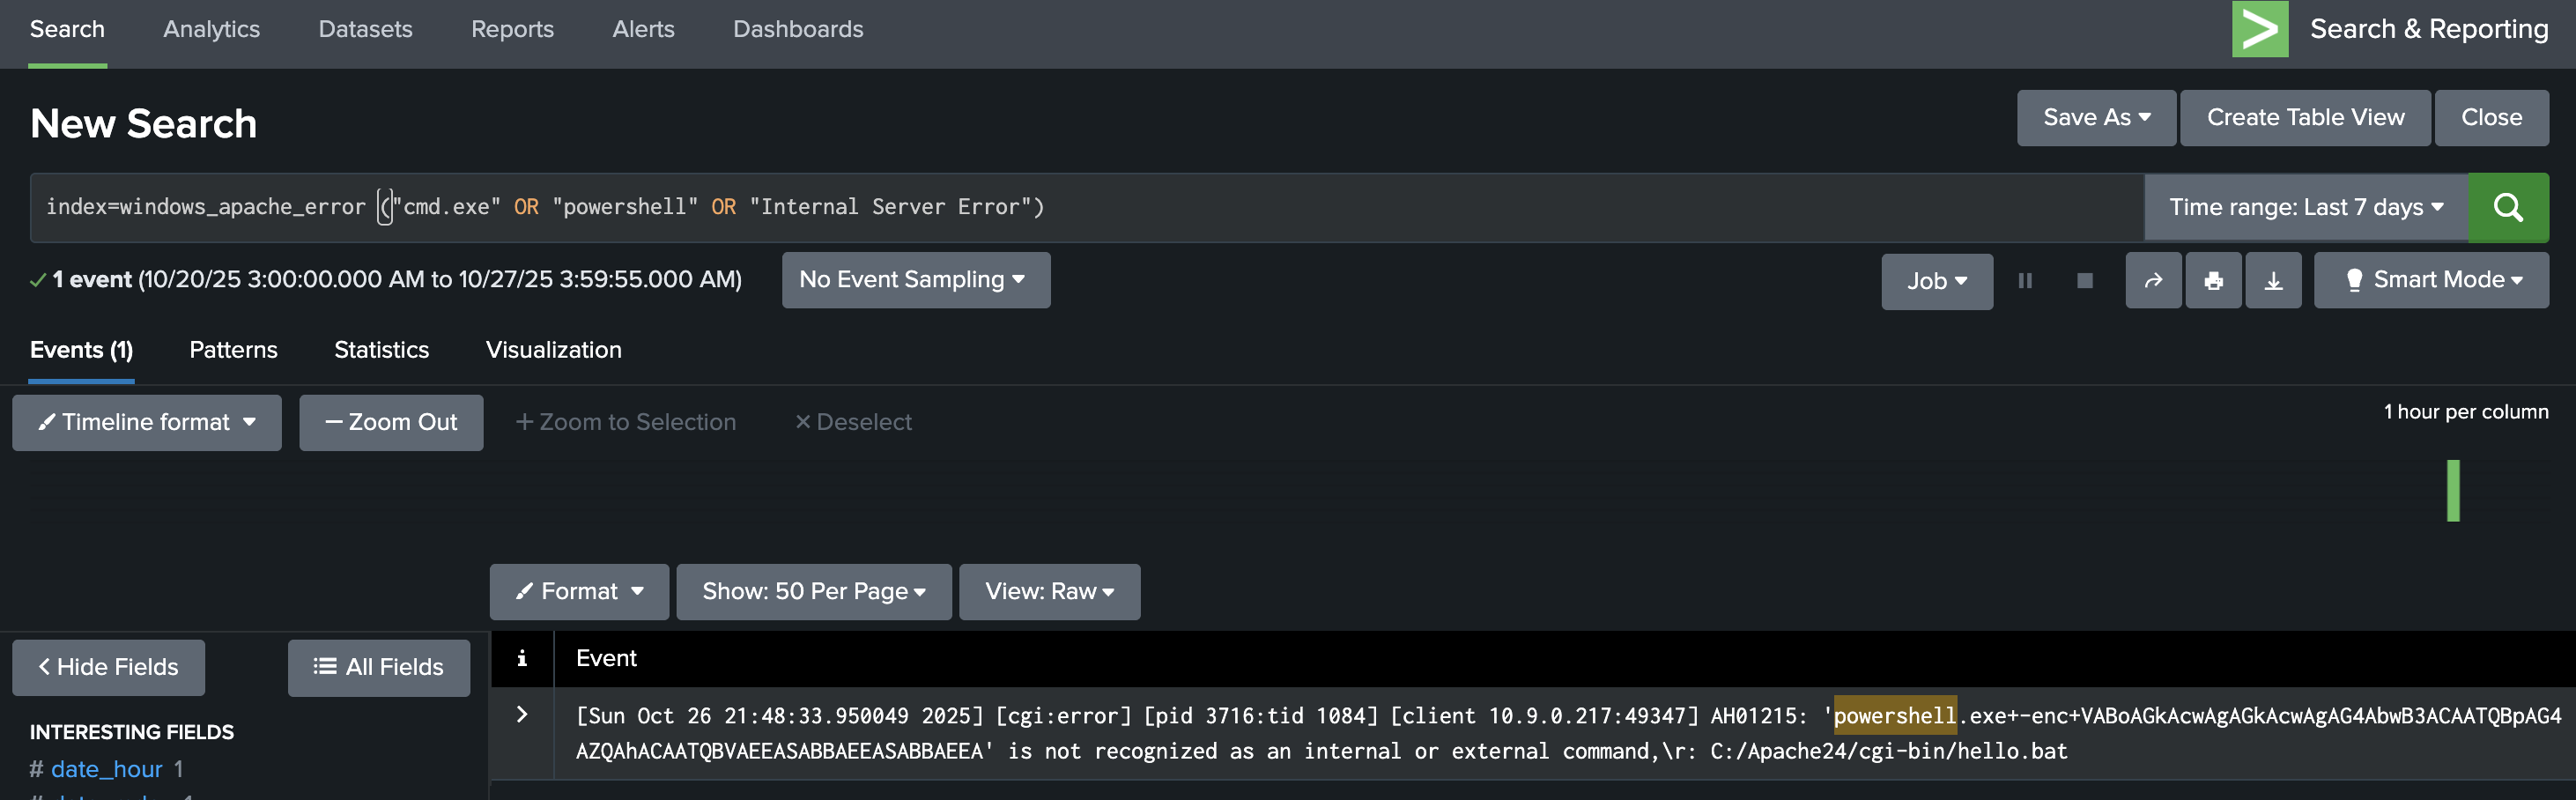
If a request like /cgi-bin/hello.bat?cmd=powershell triggers a 500 “Internal Server Error,” it often means the attacker’s input was processed by the server but failed during execution, a key sign of exploitation attempts.
Checking these results helps confirm whether the attack reached the backend or remained blocked at the web layer.
Trace Suspicious Process Creation From Apache
Let’s explore Sysmon for other malicious executable files that the web server might have spawned. We will do that using the following Splunk query:
index=windows_sysmon ParentImage="*httpd.exe"
This query focuses on process relationships from Sysmon logs, specifically when the parent process is Apache (httpd.exe).
Select View: Table on the dropdown menu above the Event display field.
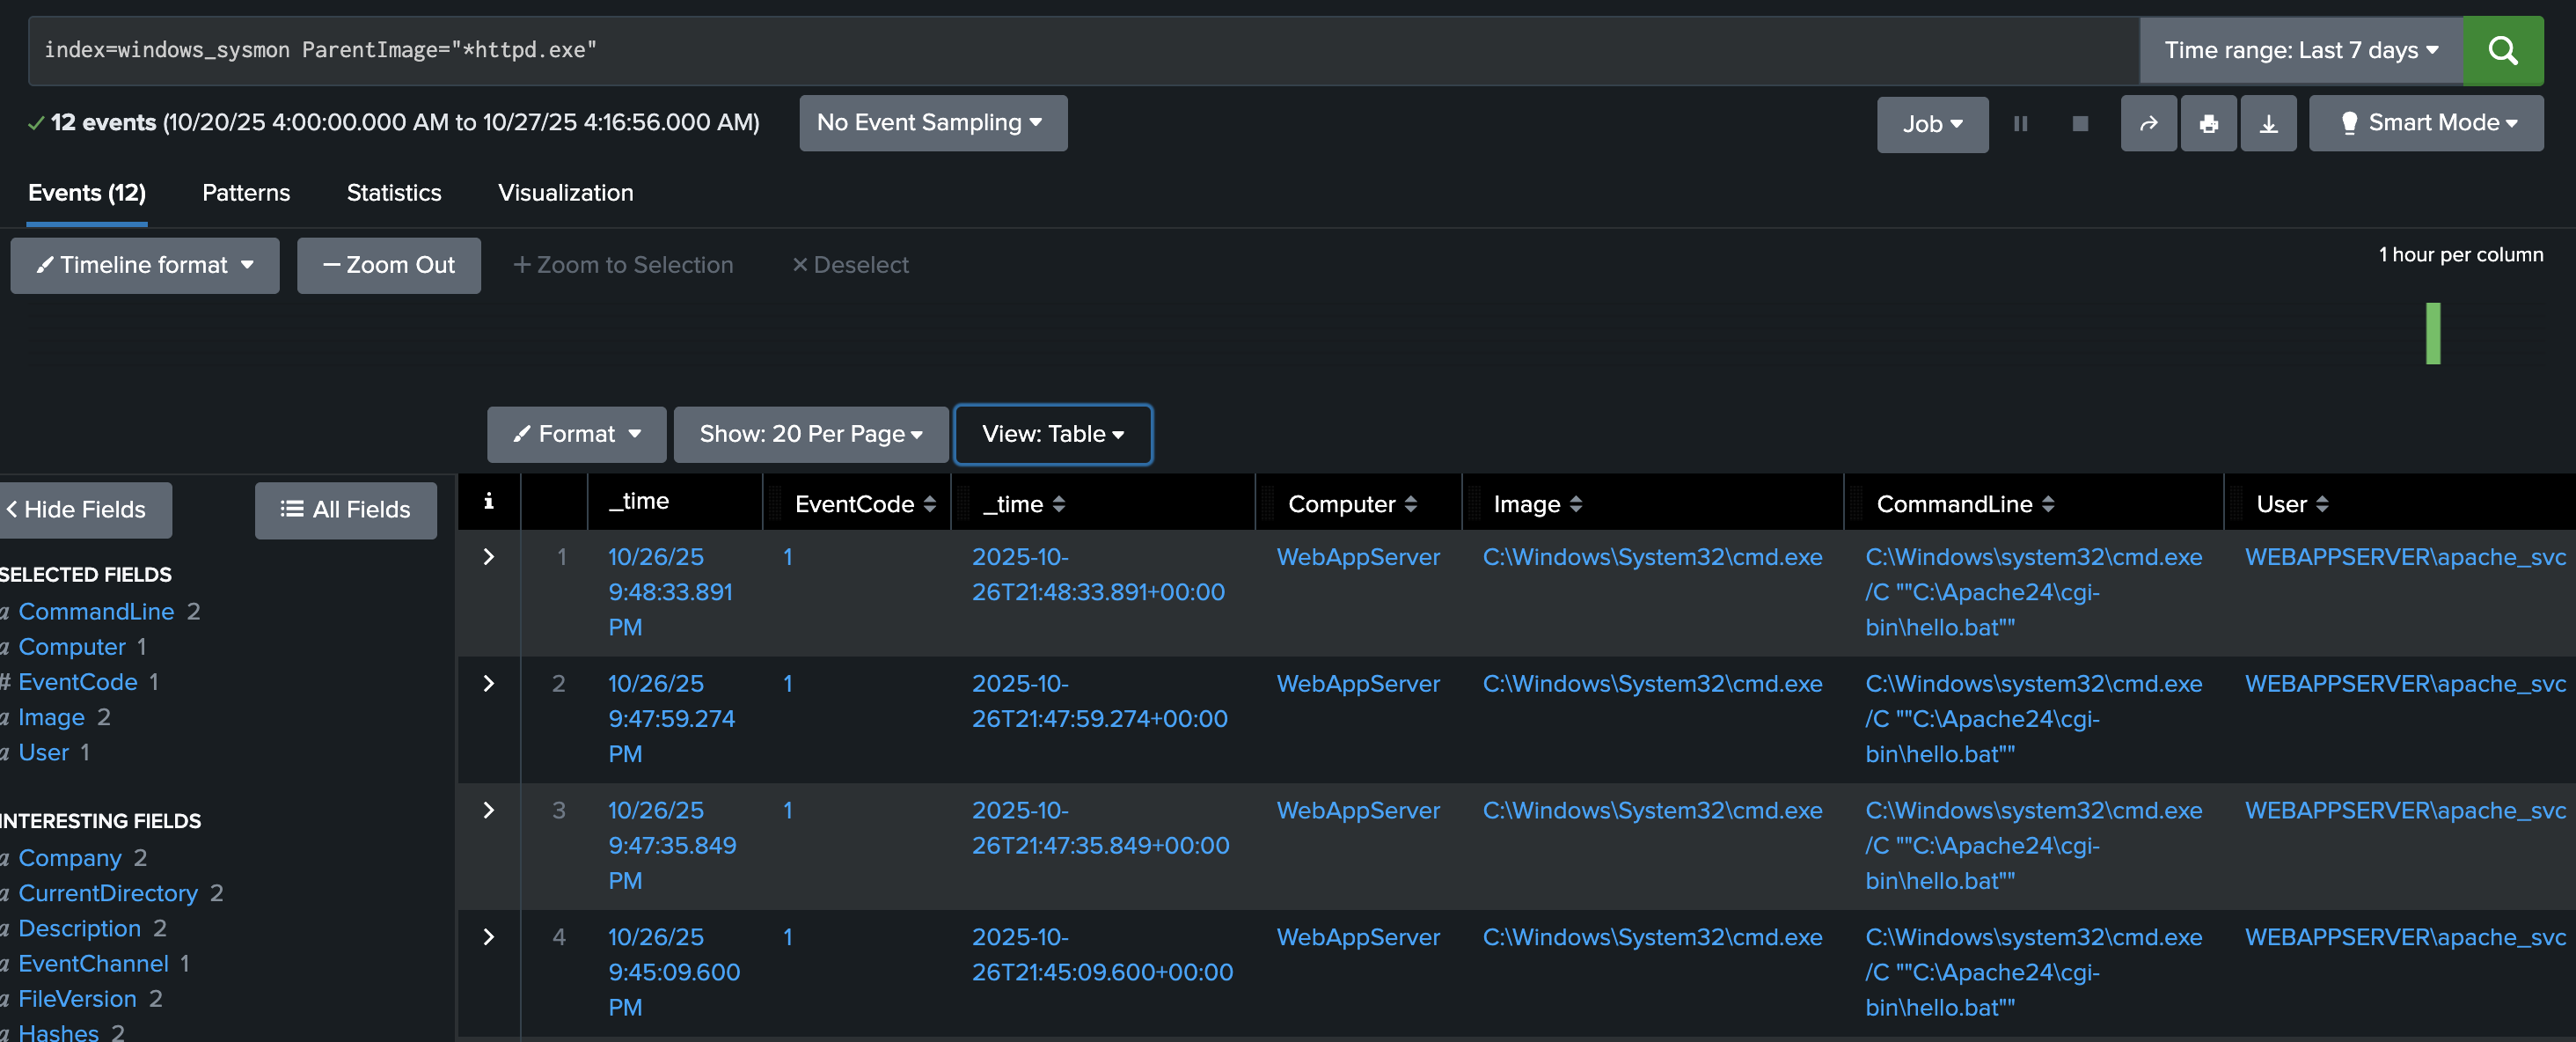
Typically, Apache should only spawn worker threads, not system processes like cmd.exe or powershell.exe.
If results show child processes such as:
ParentImage = C:\Apache24\bin\httpd.exe
Image = C:\Windows\System32\cmd.exe
It indicates a successful command injection where Apache executed a system command.
The finding above is one of the strongest indicators that the web attack penetrated the operating system.
Confirm Attacker Enumeration Activity
In this step, we aim to discover what specific programs we found from previous queries do. Let’s use the following query.
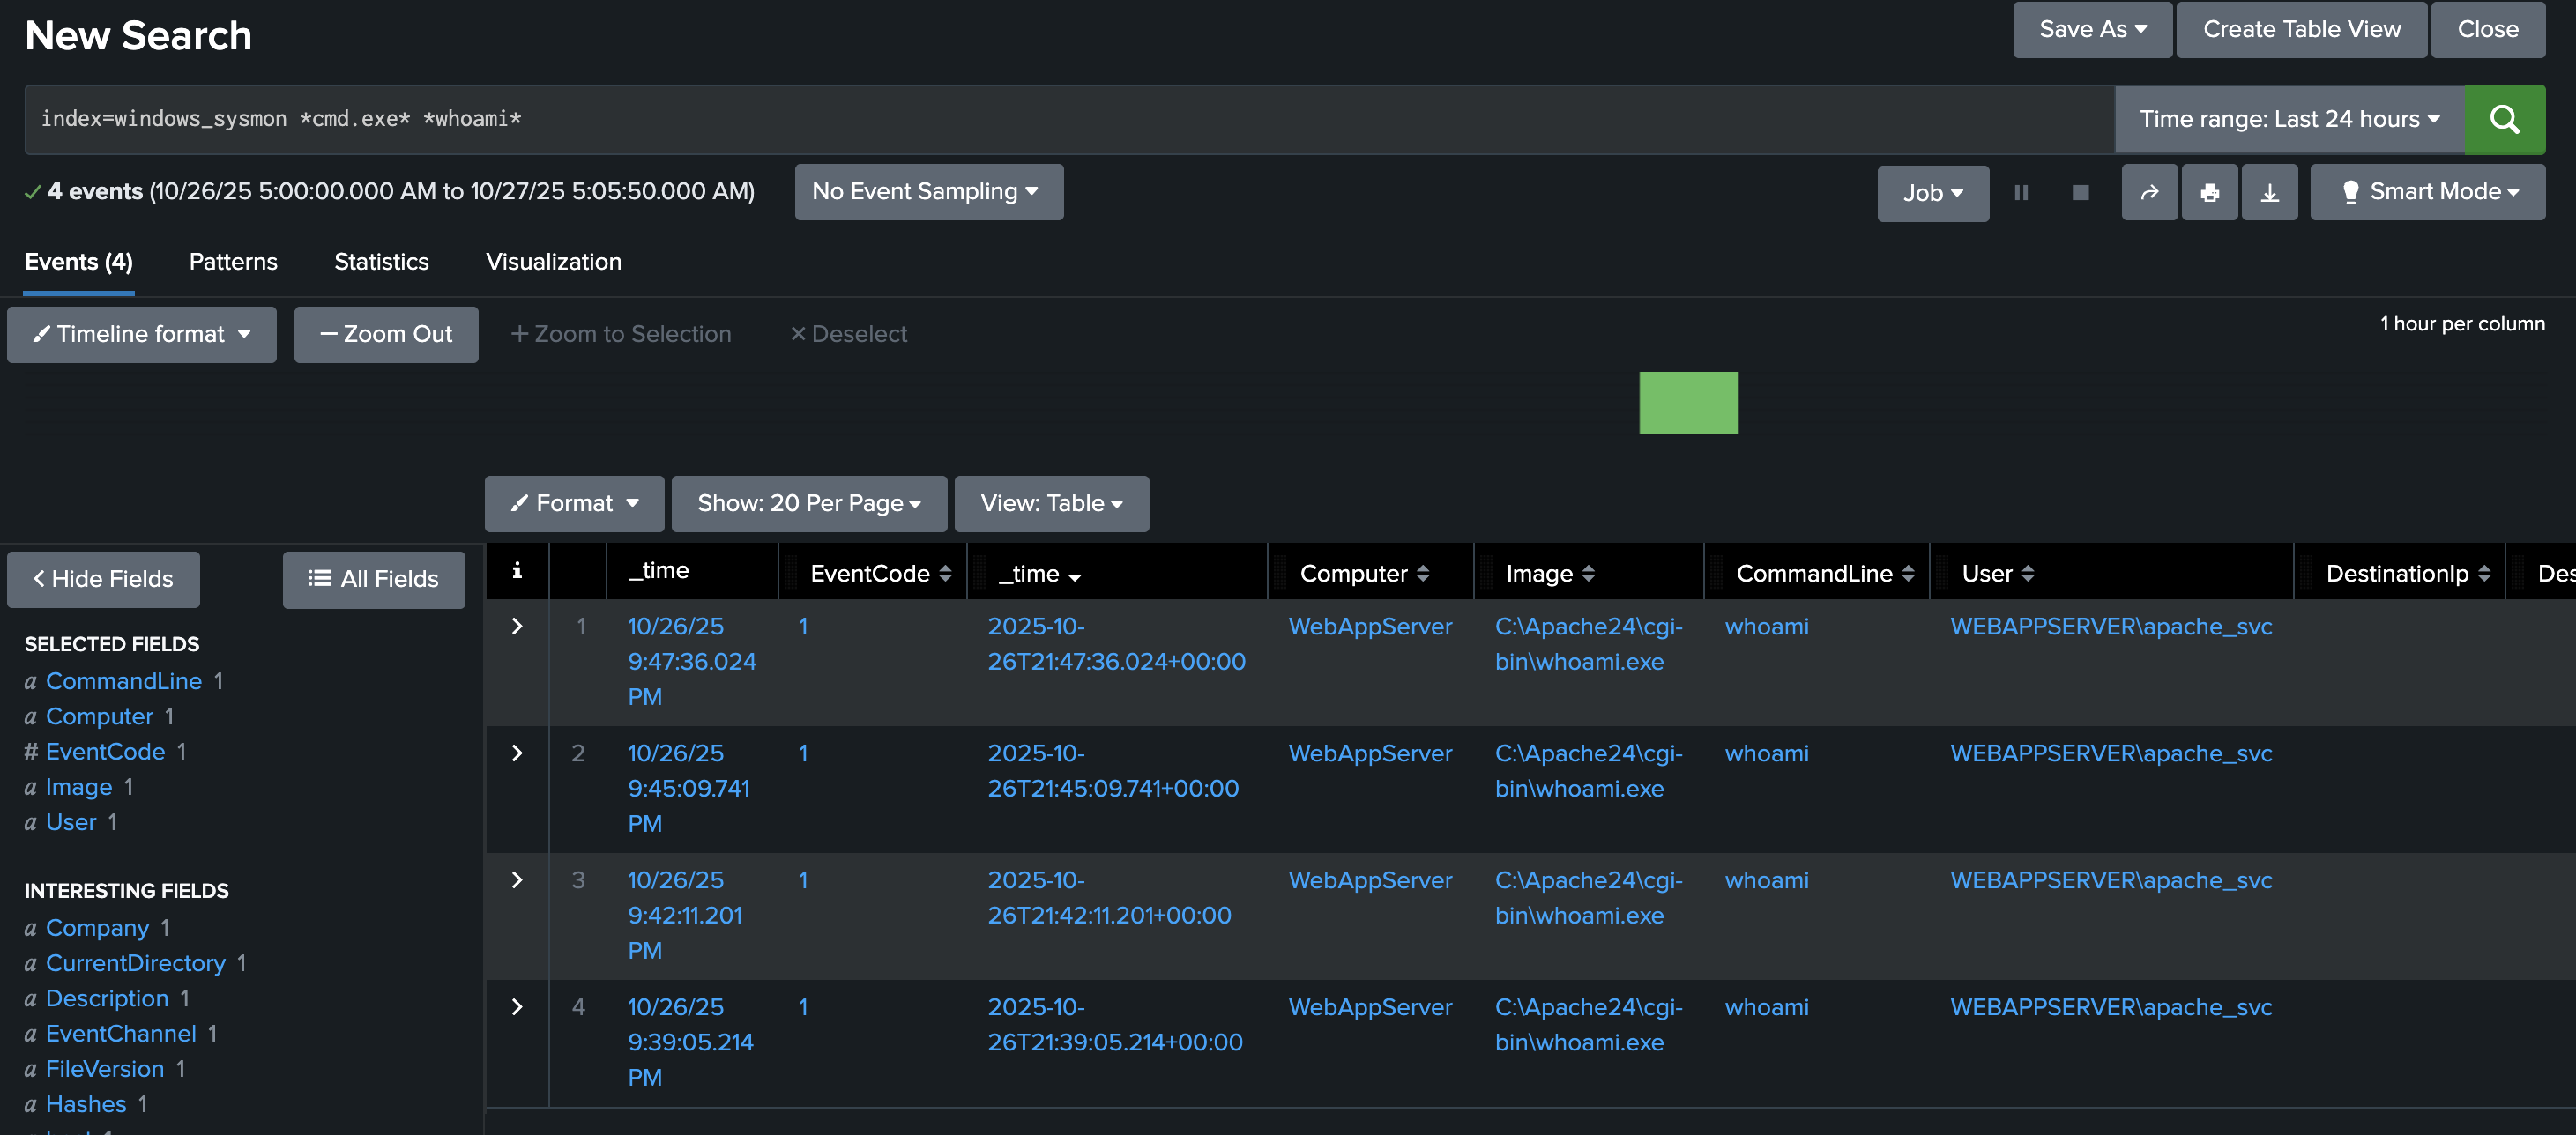
index=windows_sysmon *cmd.exe* *whoami*
This query looks for command execution logs where cmd.exe ran the command whoami.
Attackers often use the whoami command immediately after gaining code execution to determine which user account their malicious process is running as.
Finding these events confirms the attacker’s post-exploitation reconnaissance, showing that the injected command was executed on the host.
Identify Base64-Encoded PowerShell Payloads
In this final step, we will work to find all successfully encoded commands. To search for encoded strings, we can use the following Splunk query:
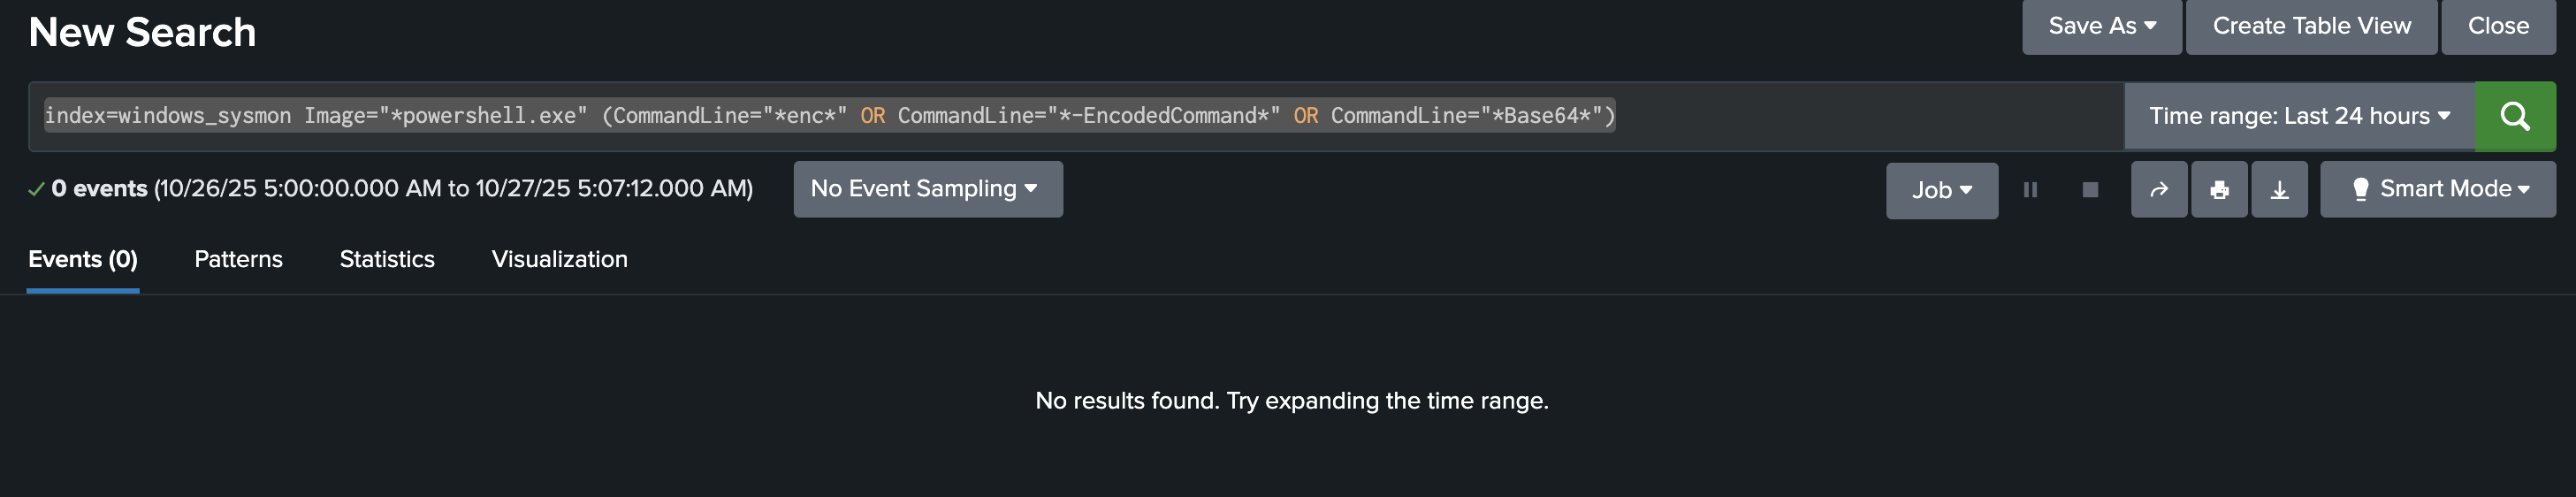
index=windows_sysmon Image="*powershell.exe" (CommandLine="*enc*" OR CommandLine="*-EncodedCommand*" OR CommandLine="*Base64*")
This query detects PowerShell commands containing -EncodedCommand or Base64 text, a common technique attackers use to hide their real commands.
If your defences are correctly configured, this query should return no results, meaning the encoded payload (such as the “Muahahaha” message) never ran.
If results appear, you can decode the Base64 command to inspect the attacker’s true intent.
Answer
Question 1
What is the reconnaissance executable file name?
Answer
Question 2
What executable did the attacker attempt to run through the command injection?