TryHackMe: Advent Of Cyber 2024 Day 17

An attack now, it seems, on the town's CCTV,
There's a problem with the logs, but what could it be?
An idea put forward of a log format switch,
Not as expected, the idea of the Glitch!
 https://tryhackme.com/r/room/adventofcyber2024
Background Story

Marta May Ware is going crazy: someone has disconnected the main server from the Wareville network, and nobody knows who it is! As soon as she realized it, she contacted Wareville’s top physical security company, WareSec&Aware, to let her view the data centre’s CCTV streams. They forbade it entirely: for privacy reasons, only the camera owner can view the recordings. Not even the WareSec&Aware employees themselves are allowed to do so.
Still, they said there was no recording of anybody entering the data centre yesterday! How could that be, wondered Marta May, desperate for answers. Their first supposition was that the owner of the cameras must have deleted the recordings from their managing web page. But the data centre’s camera owner surely can’t be the perpetrator: it is no other than Byte, Glitch’s dog! Glitch insisted with Marta to leave the ownership of the cameras to Byte precisely to avoid these kinds of happenings: Byte, the ultimate good boy, combines loyalty and sharp instincts to keep any place safe.
Marta May calls Glitch and McSkidy right away, explaining the situation in between the sobs. Glitch’s eyes darken: Someone is trying to frame Byte, and he will not let anybody vex his beautiful dog!
McSkidy is perplexed: why are the people at WareSec&Aware “supposing” that Byte had deleted the recordings? Shouldn’t they have some logs to prove such an accusation?
Marta May has the answer: they do have some log files that they back up every 6 hours, give or take.
But they can’t search through it—or rather, they tried, but when they go and search for some keyword like the data centre’s cameras’ IDs or the action “delete”, this is what they get:
1
2
3
4
5
6
7
8
9
user@tryhackme$ cat cctv_logs.log| grep -i "11"
2024-12-16 22:53:06 WatchCamera 5 byte 11 rij5uu4gt204q0d3eb7jj86okt
RecordingInfo: 1 11 rij5uu4gt204q0d3eb7jj86okt
2024-12-16 22:53:22 WatchCamera 5 byte 11 rij5uu4gt204q0d3eb7jj86okt
RecordingInfo: 1 11 rij5uu4gt204q0d3eb7jj86okt
2024-12-16 22:53:25 WatchCamera 5 byte 11 rij5uu4gt204q0d3eb7jj86okt
user@tryhackme$
user@tryhackme$ cat cctv_logs.log| grep -i "download"
2024-12-16 22:52:50 DownloadRecording 5 byte 51 10 opfg6ns9khsbpq0u4us6dro2m8
Unreadable!
McSkidy shakes her head: they must immediately send the log file to the SOC team! Armed with a SIEM, no log is unsearchable!
Learning Objectives
In this task, we will explore the following learning objectives while investigating the logs related to the incident scenario explained above:
- Learn how to extract custom fields in Splunk
- Learn to create a parser for the custom logs
- Filter and narrow down the search results using Search Processing Language (SPL)
- How to investigate in Splunk
Investigation Time
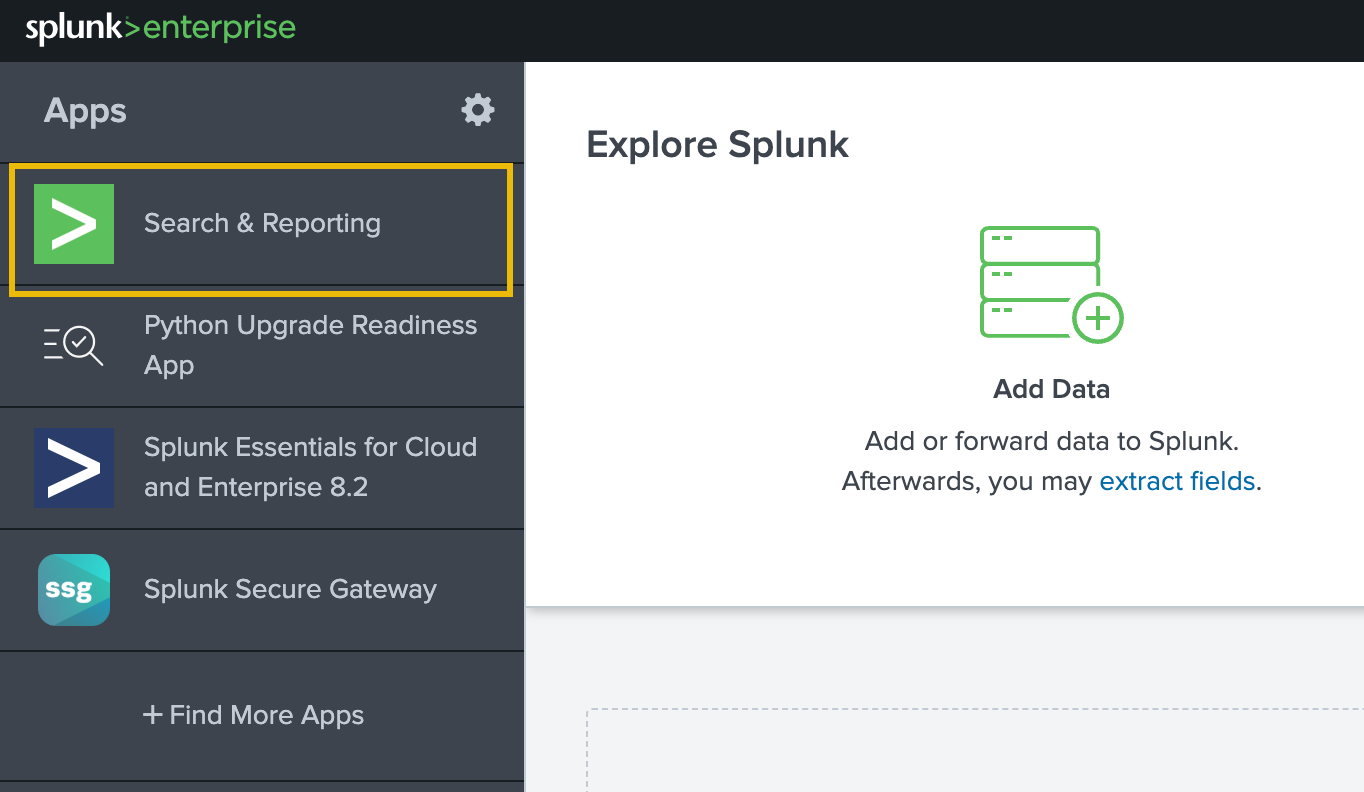
It’s time to fire up Splunk, where the data has been pre-ingested for us to investigate the incident. Once the lab is connected, open up the link in the browser and click on Search & Reporting on the left.
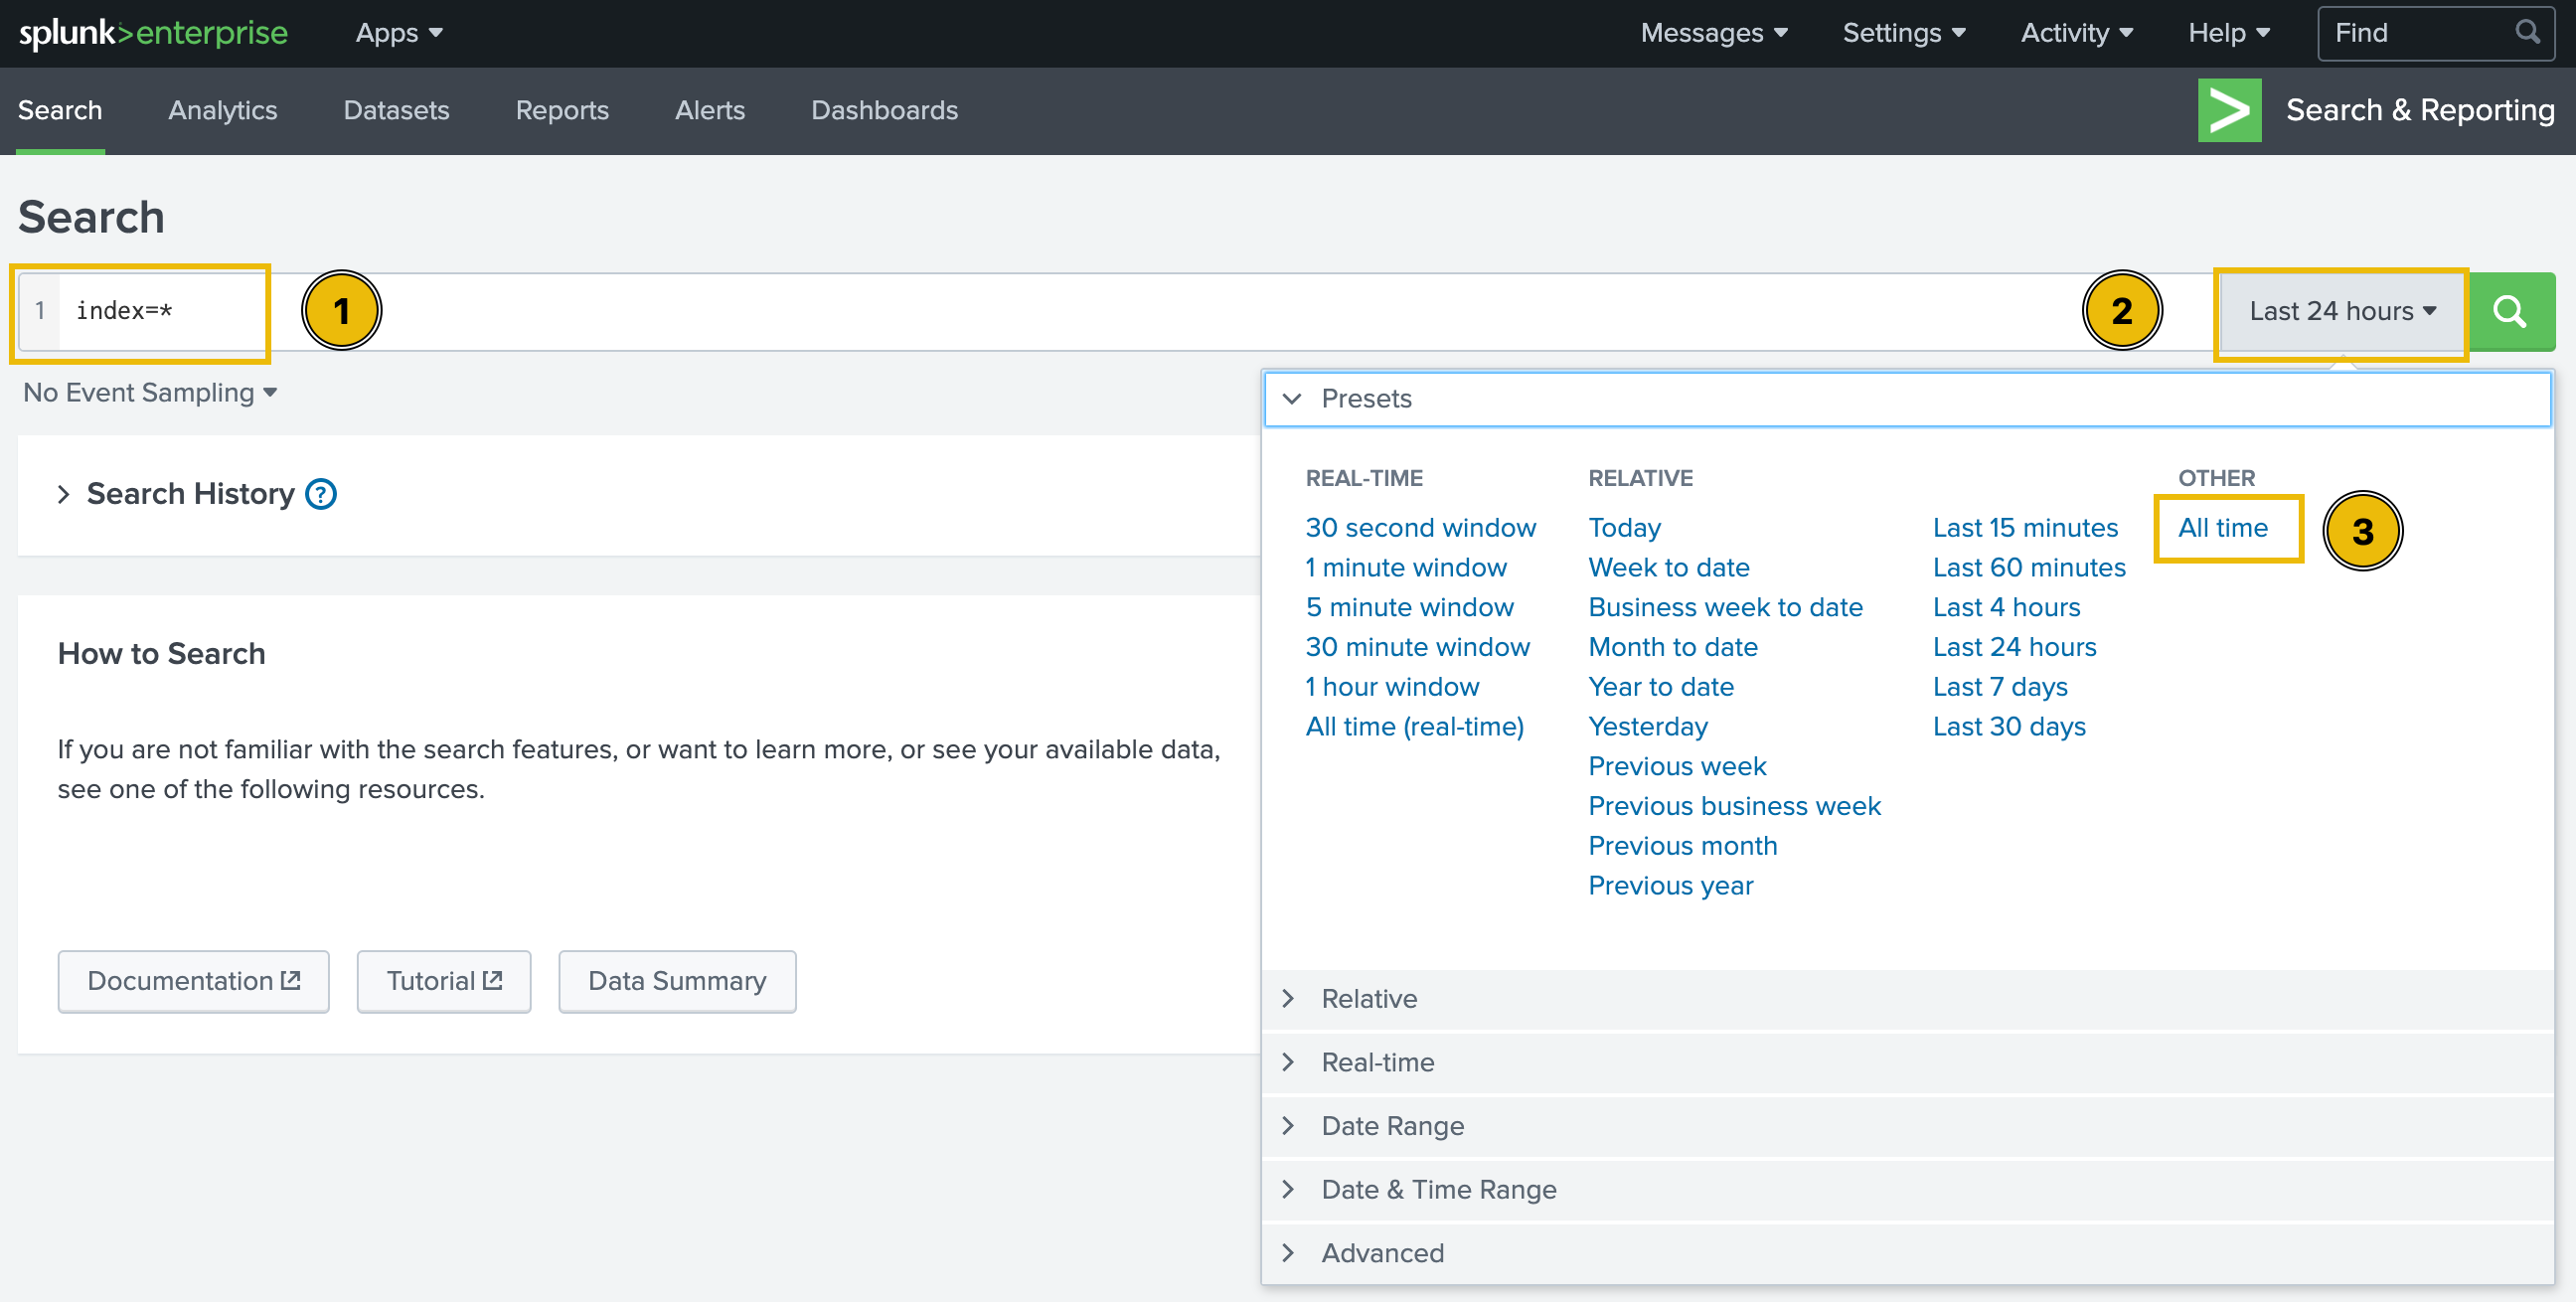
On the next page, type index=* in the search bar to show all ingested logs. Note that we will need to select All time as the time frame from the drop-down on the right of the search bar.
After running the query, we will be presented with two separate datasets pre-ingested to Splunk. We can verify this by clicking on the sourcetype field in the fields list on the left of the page.
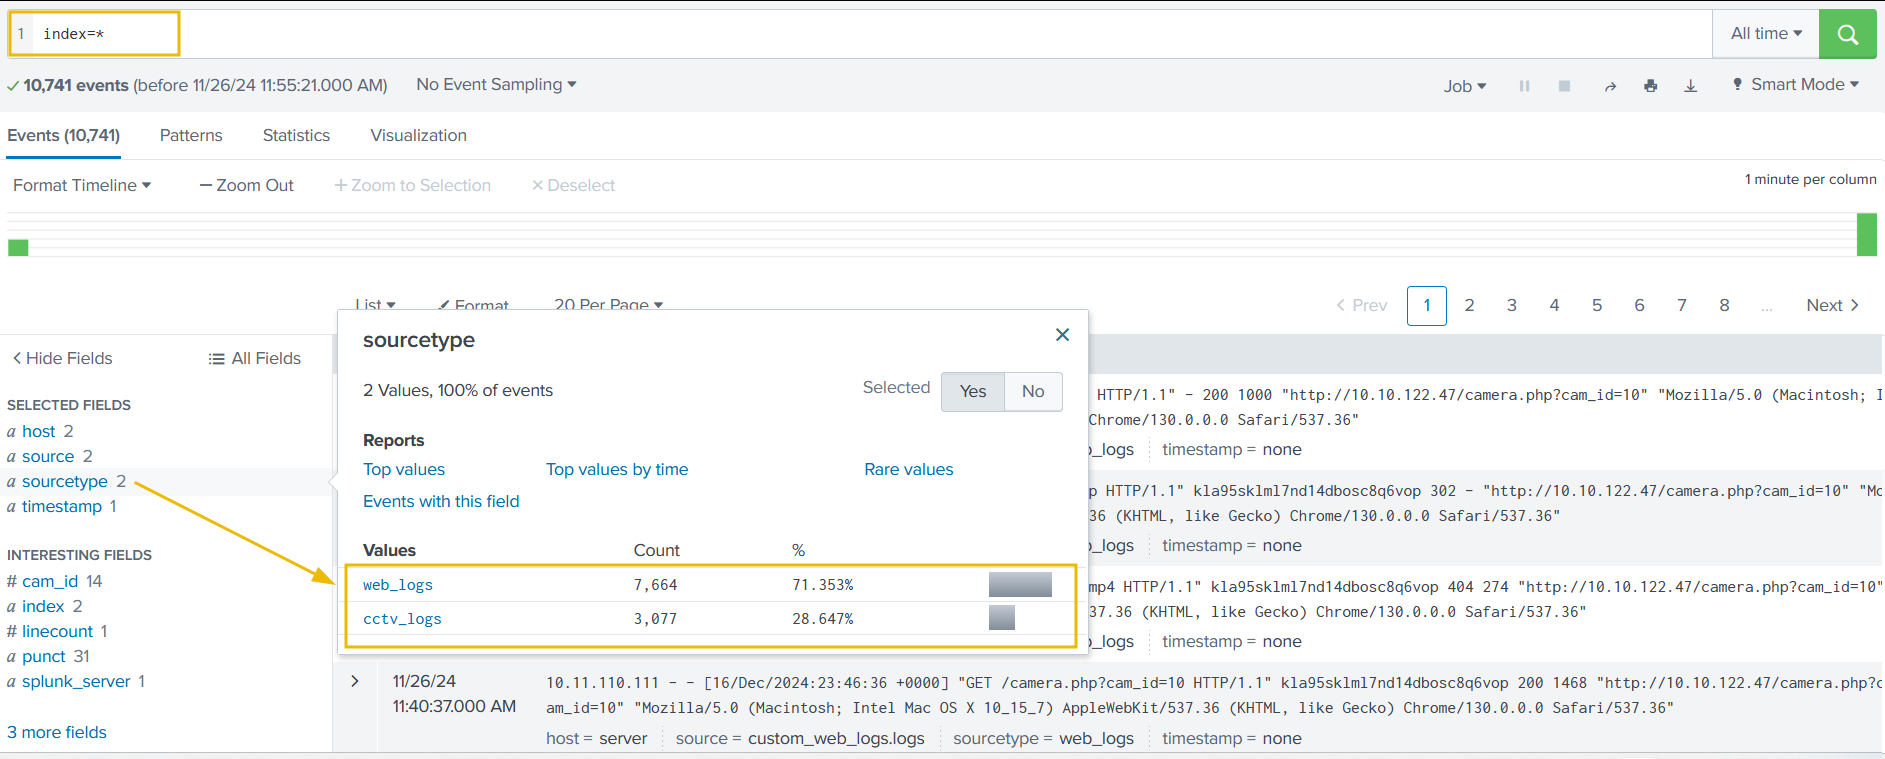
The two datasets are as follows:
- web_logs: This file contains events related to web connections to and from the CCTV web server.
- cctv_logs: This file contains information about the CCTV application access logs.
Let’s explore the logs and investigate the attack on our CCTV servers to identify the culprit, who got unauthorized access to the server and deleted the CCTV streams.
Examining CCTV Logs
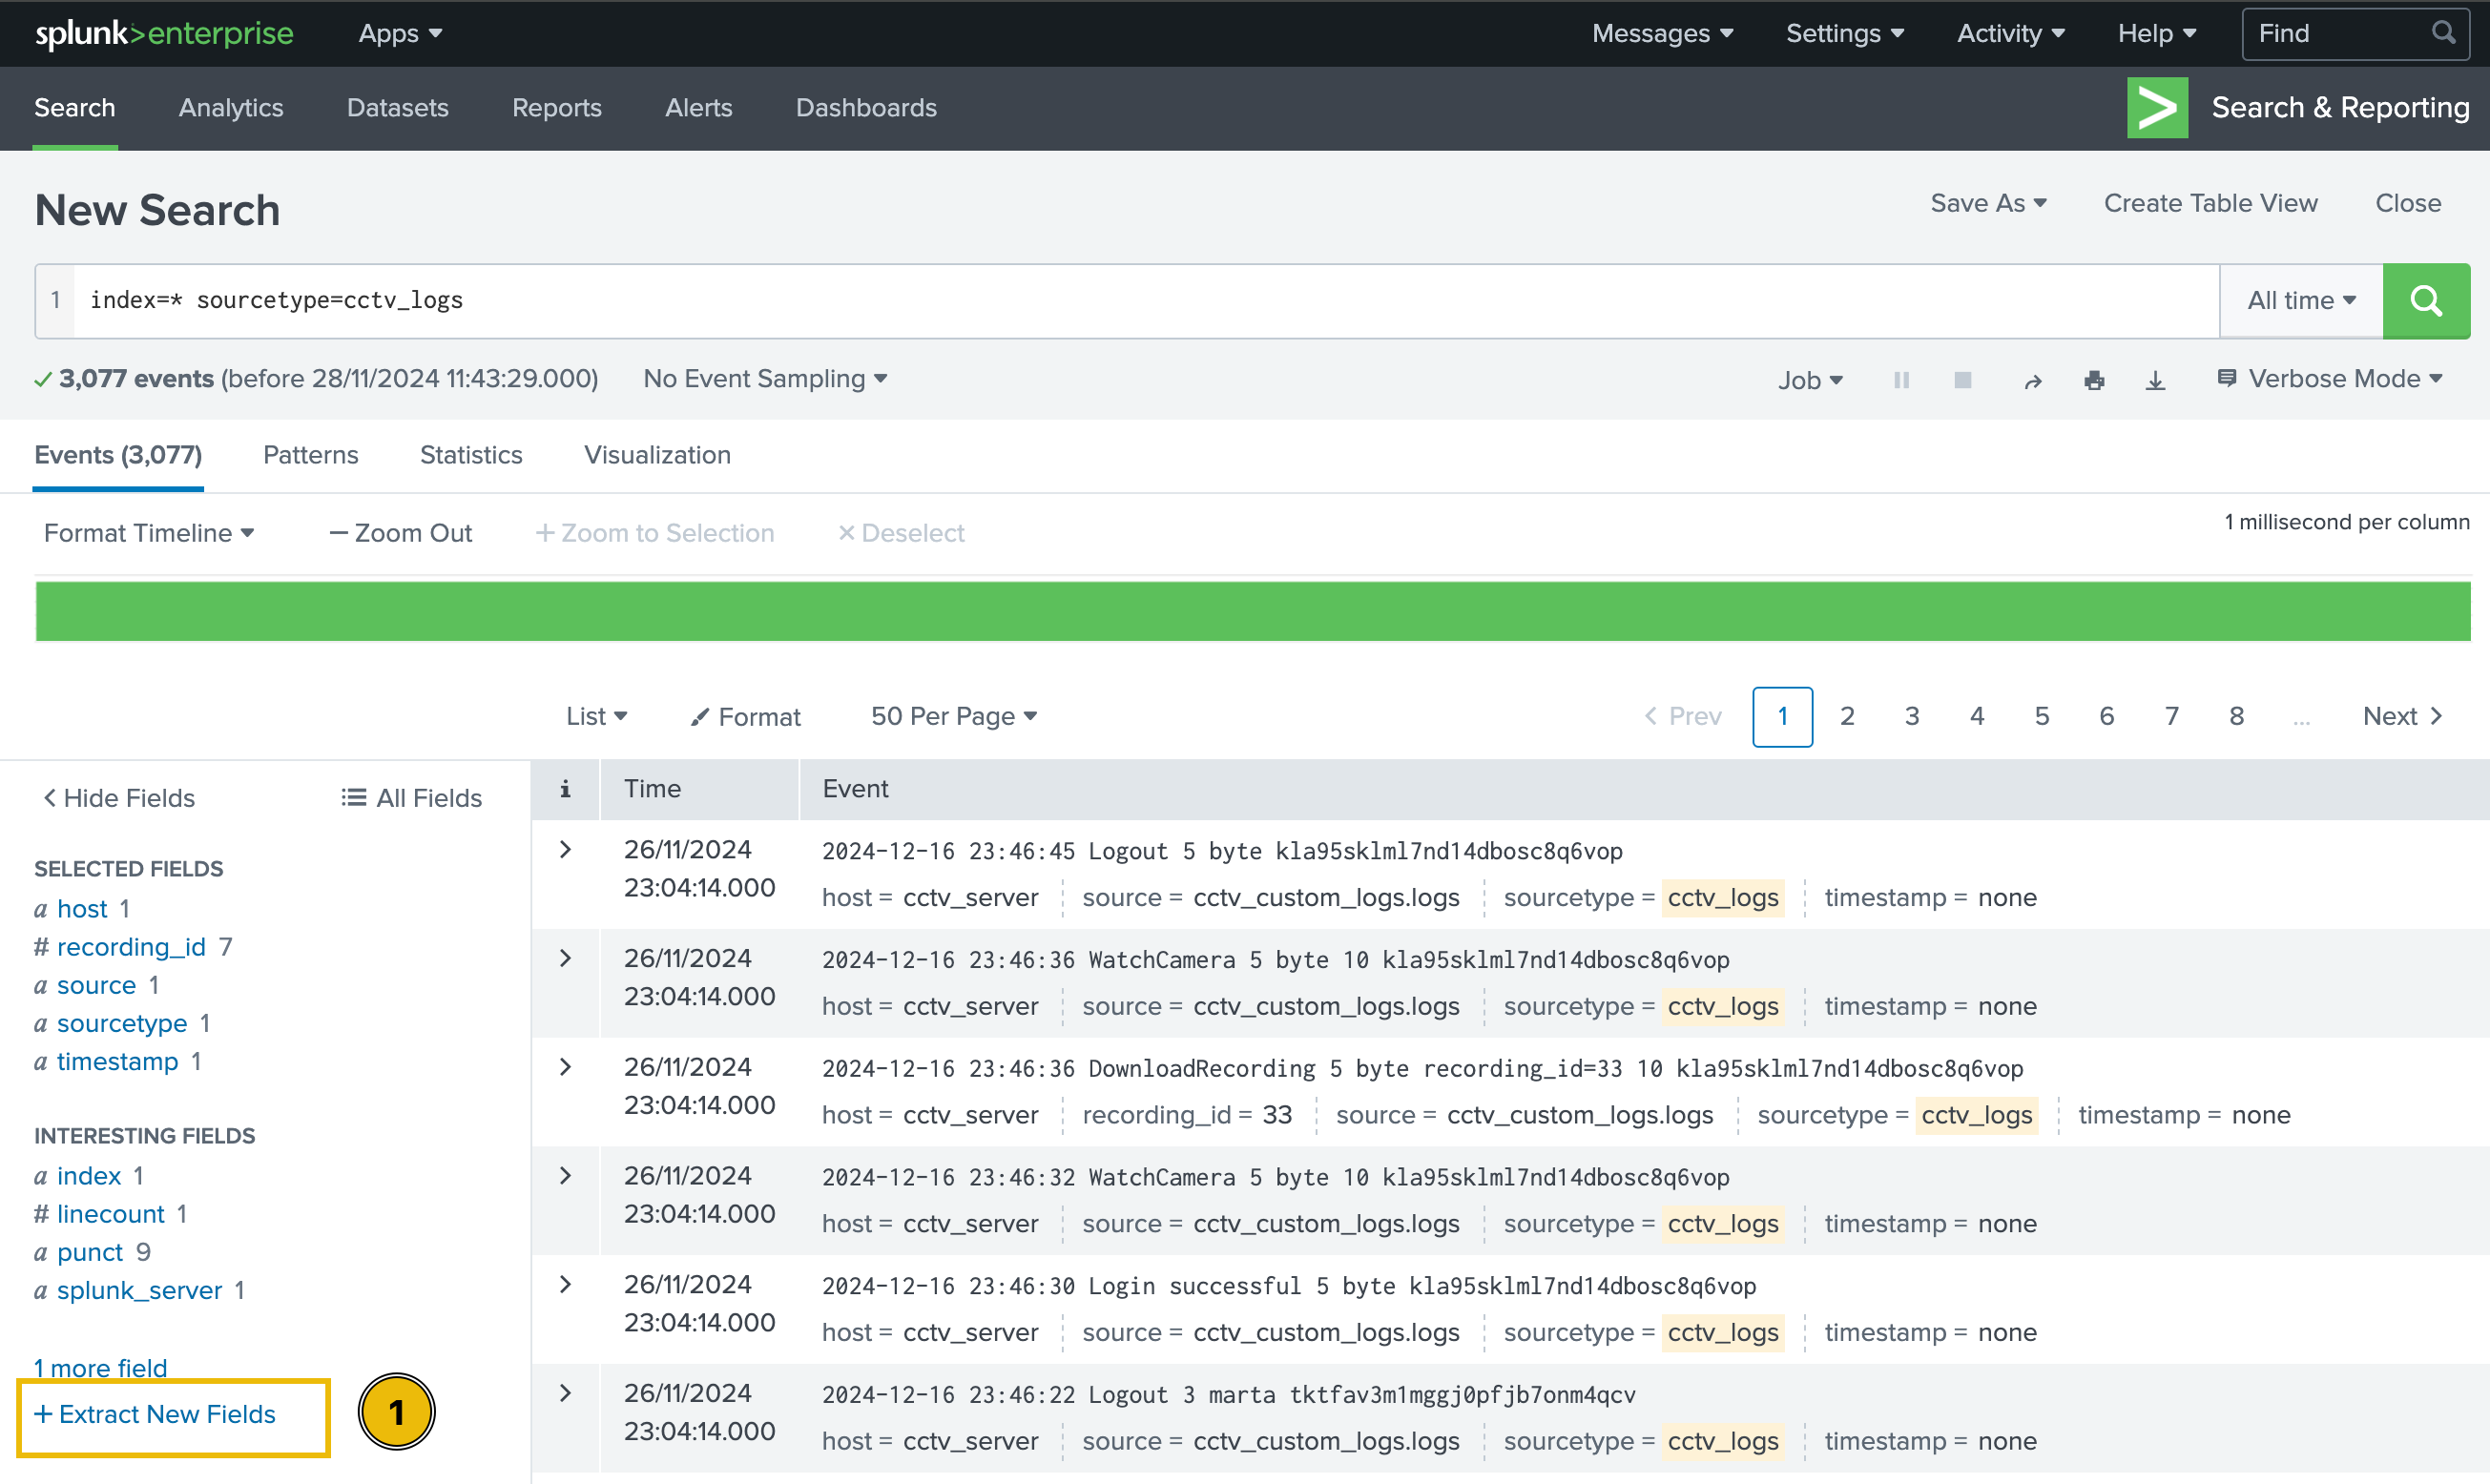
Let’s start our investigation by examining the CCTV logs. To do so, we can either click on the corresponding value for the sourcetype field, or type the following query in the search bar:
index=* sourcetype=cctv_logs

Understanding the Problem
After examining the logs, we can figure out the following main issues:
- Logs are not parsed properly by Splunk.
- Splunk does not consider the actual timeline of the event; instead, it uses only the ingestion time.
Fixing the Problem
Before analysing and investigating the logs, we must extract the relevant fields from them and adjust the timestamp.
The provided logs were generated from a custom log source, so Splunk could not parse the fields properly.
Extract New Field
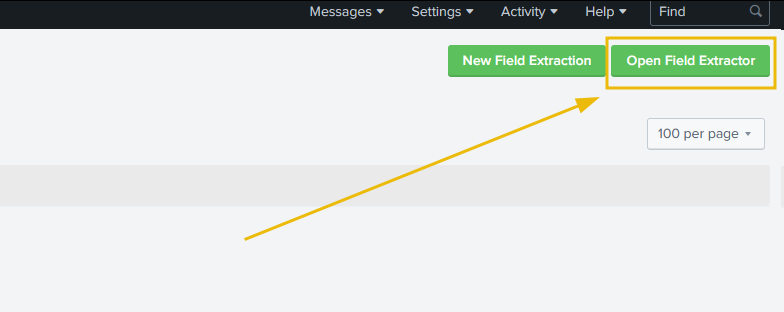
Click on the Extract New Fields option, located below the fields list on the left of the page.
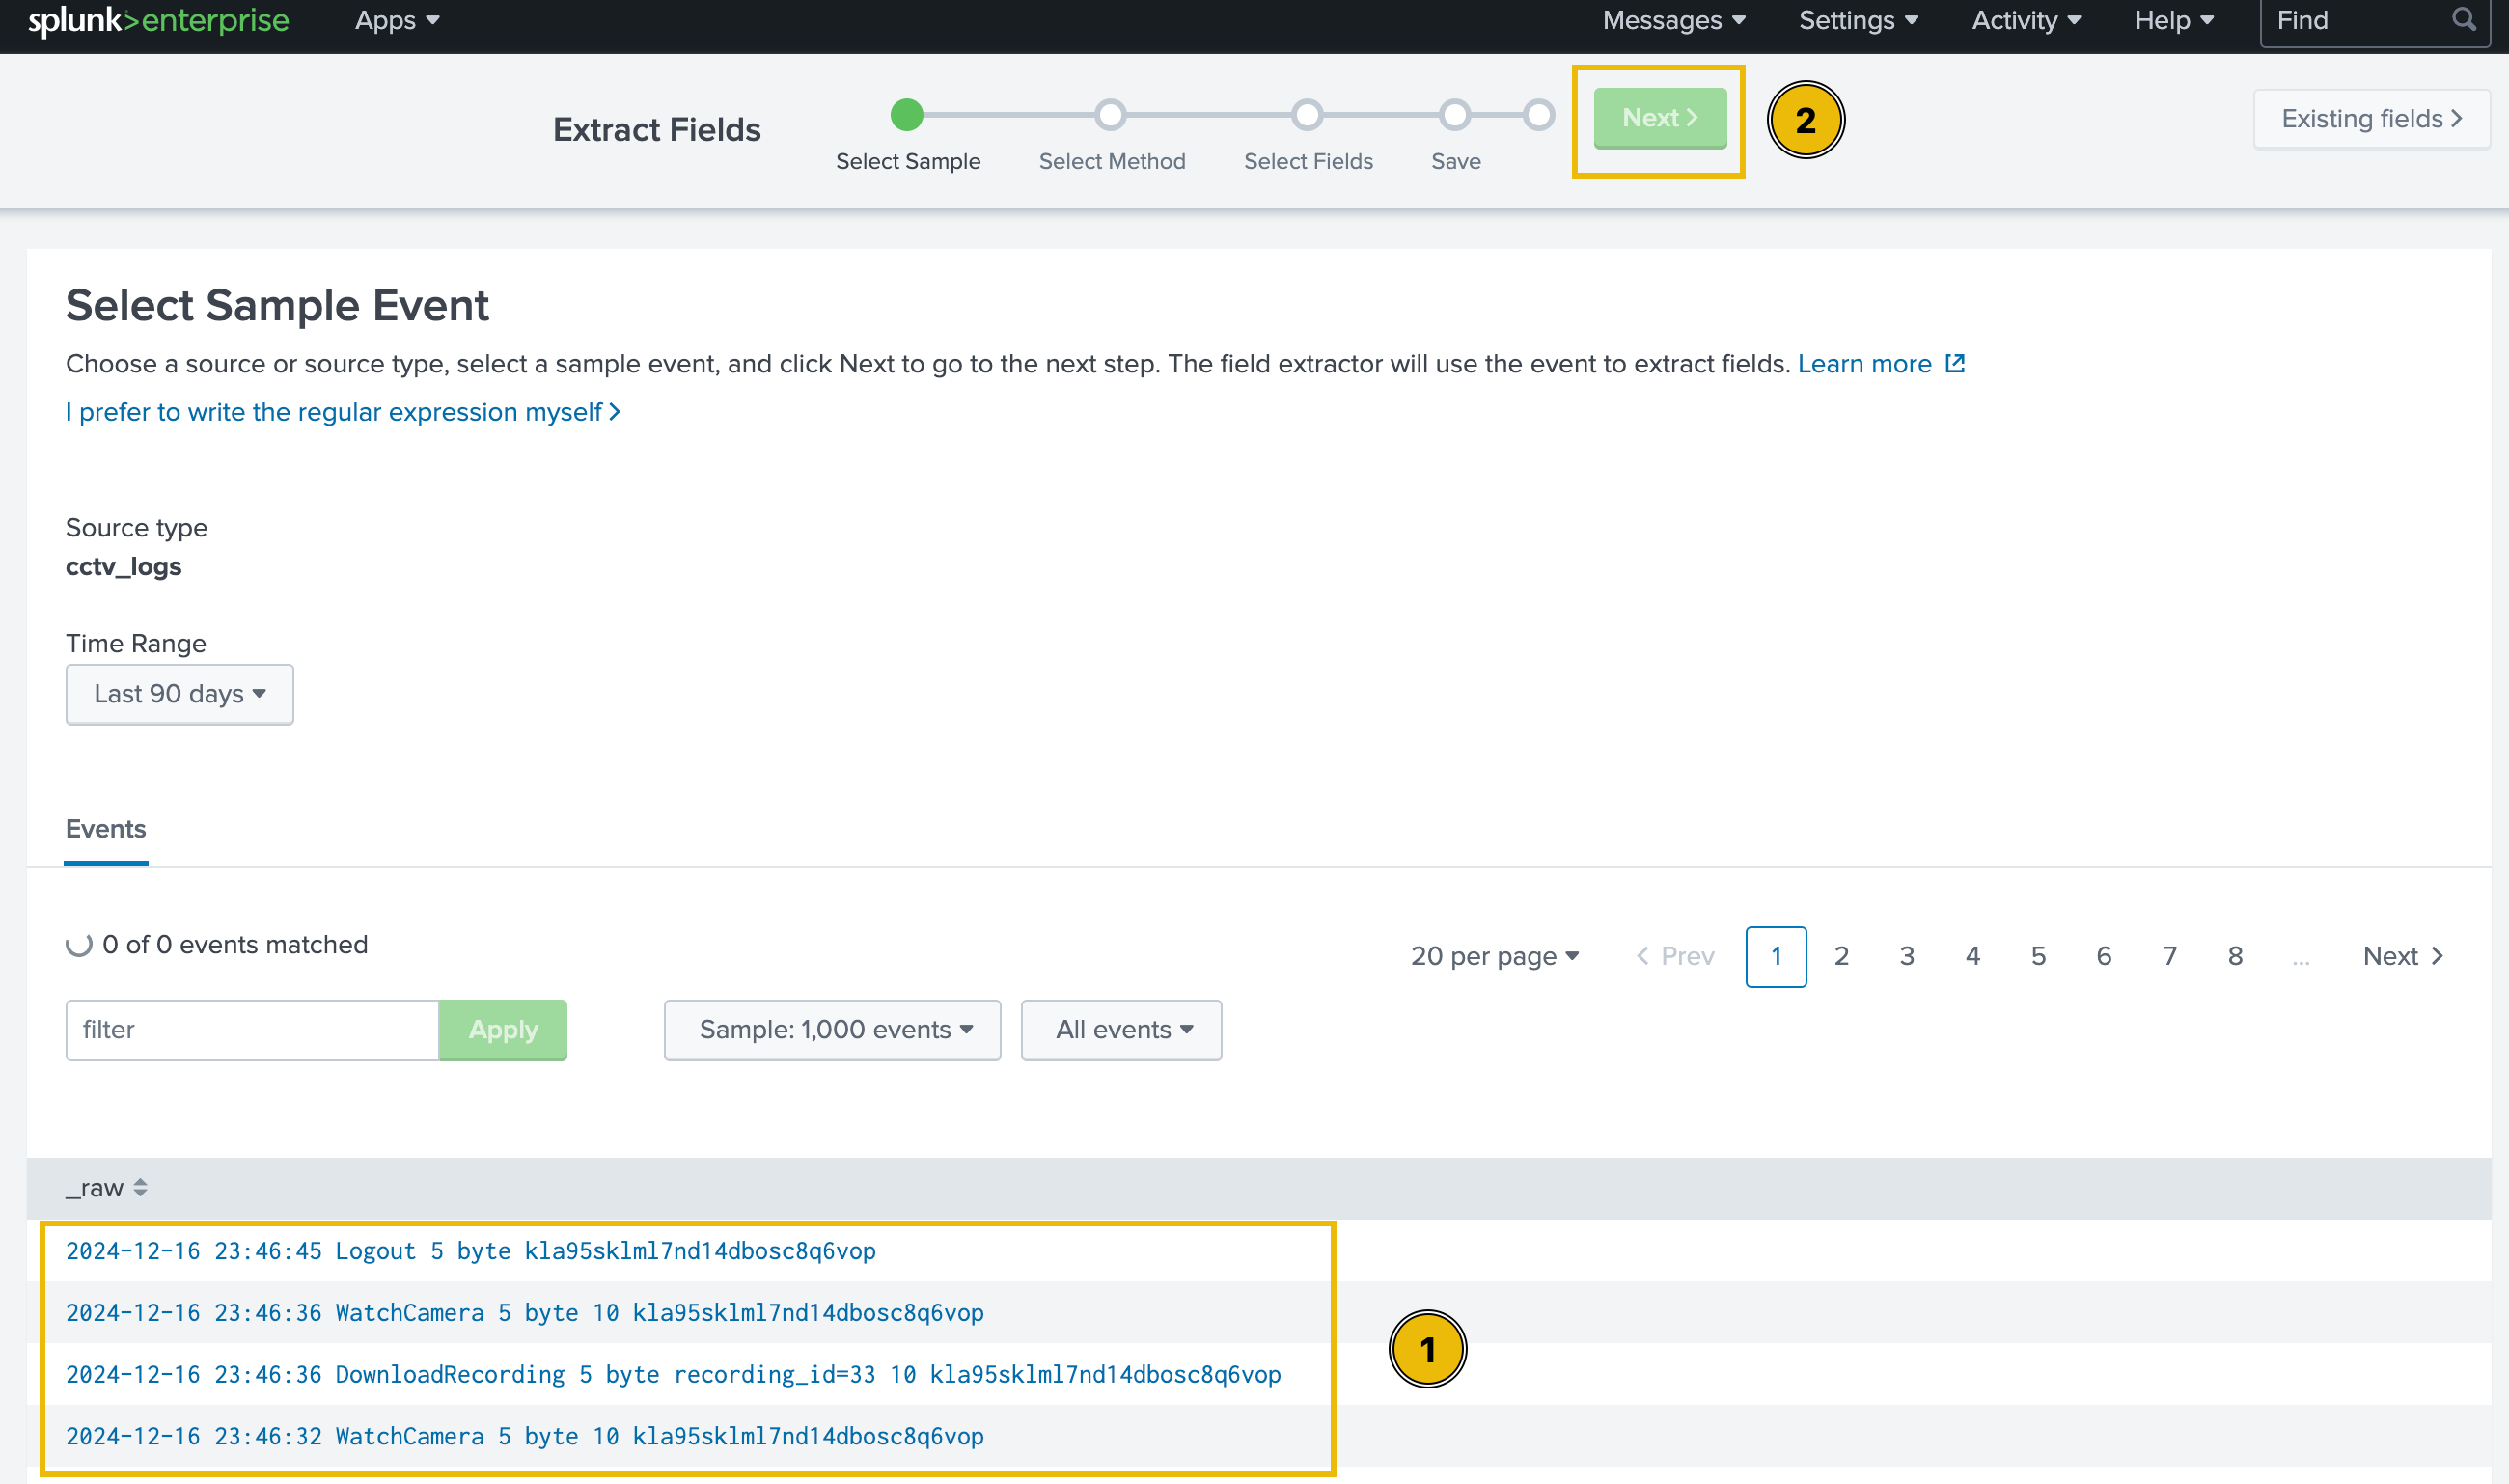
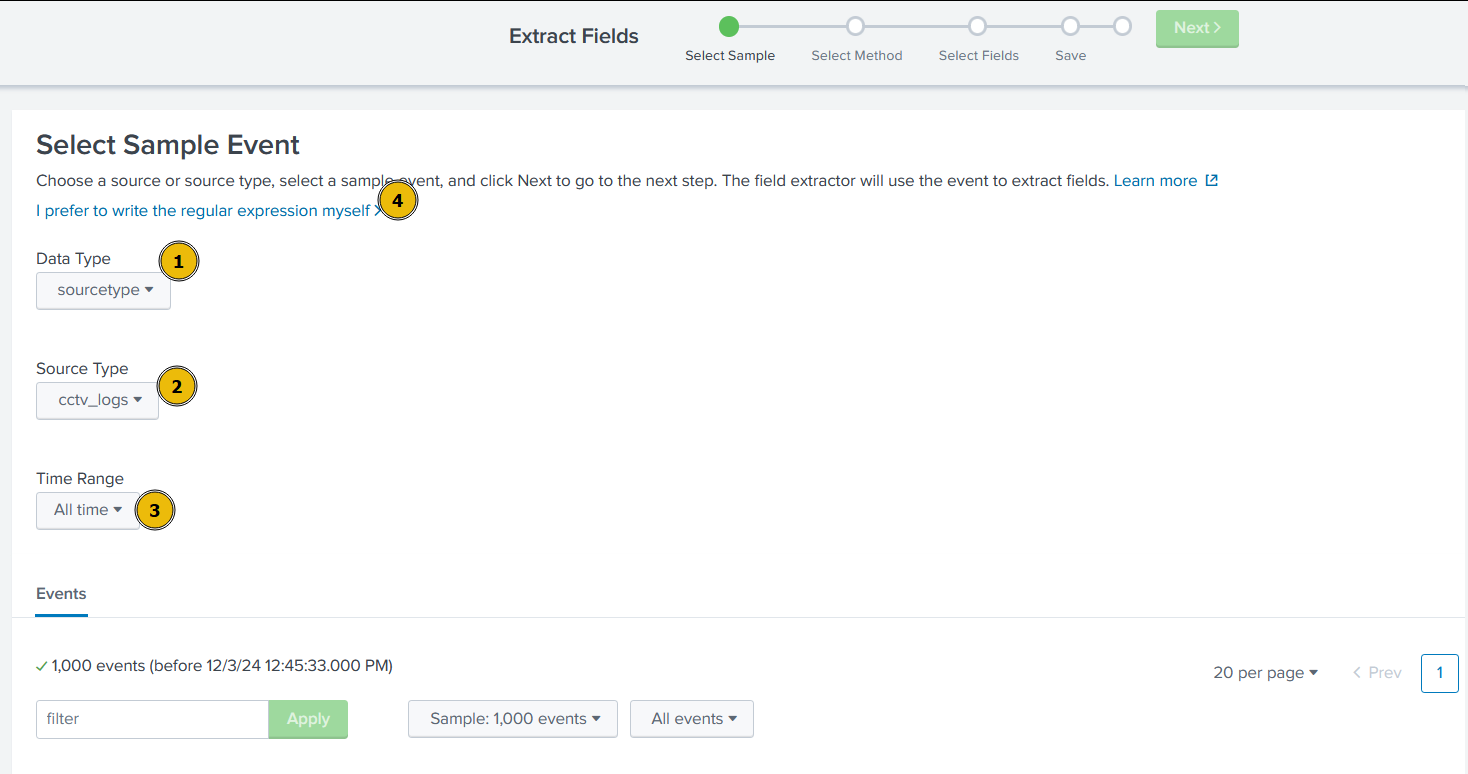
Select Sample Event
We will be presented with event logs that must be parsed properly. Though, we can select any log, but in order to follow the steps mentioned below, and avoid confusion, let’s select the very first sample event and click on the green Next button at the top of the page.
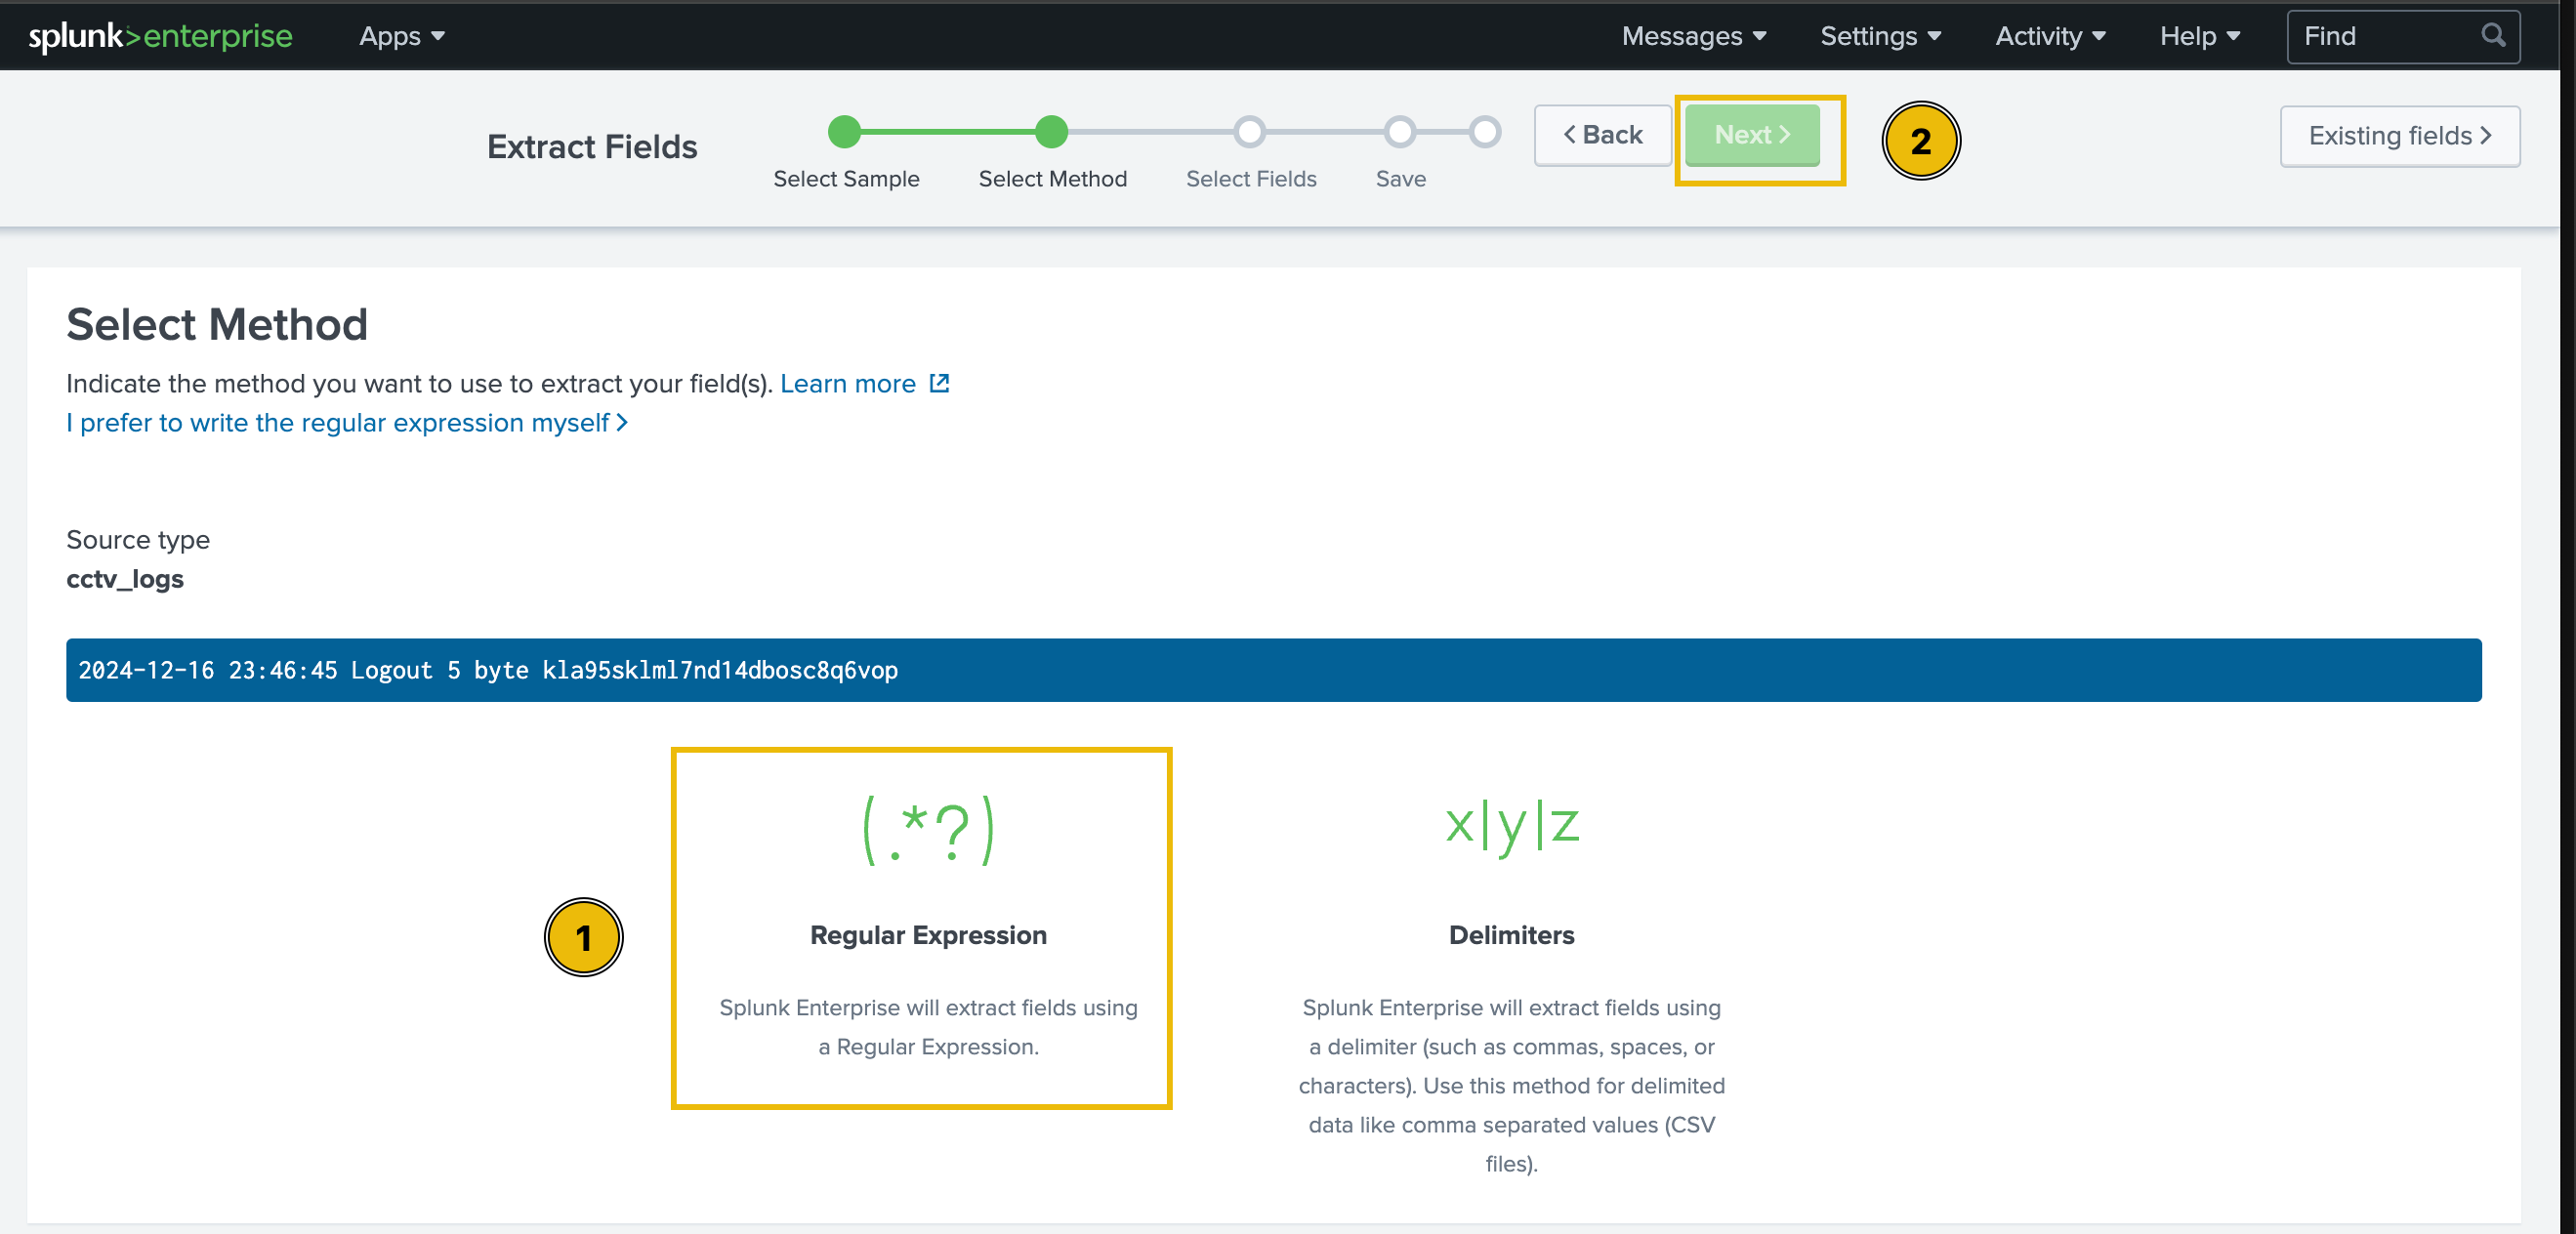
Select Method
There are two options for extracting the fields: using Regular Expressions and using Delimiters. In this exercise, we will extract fields using Regular Expressions. Select this option and then click on the green Next button at the top of the page.
Select Fields
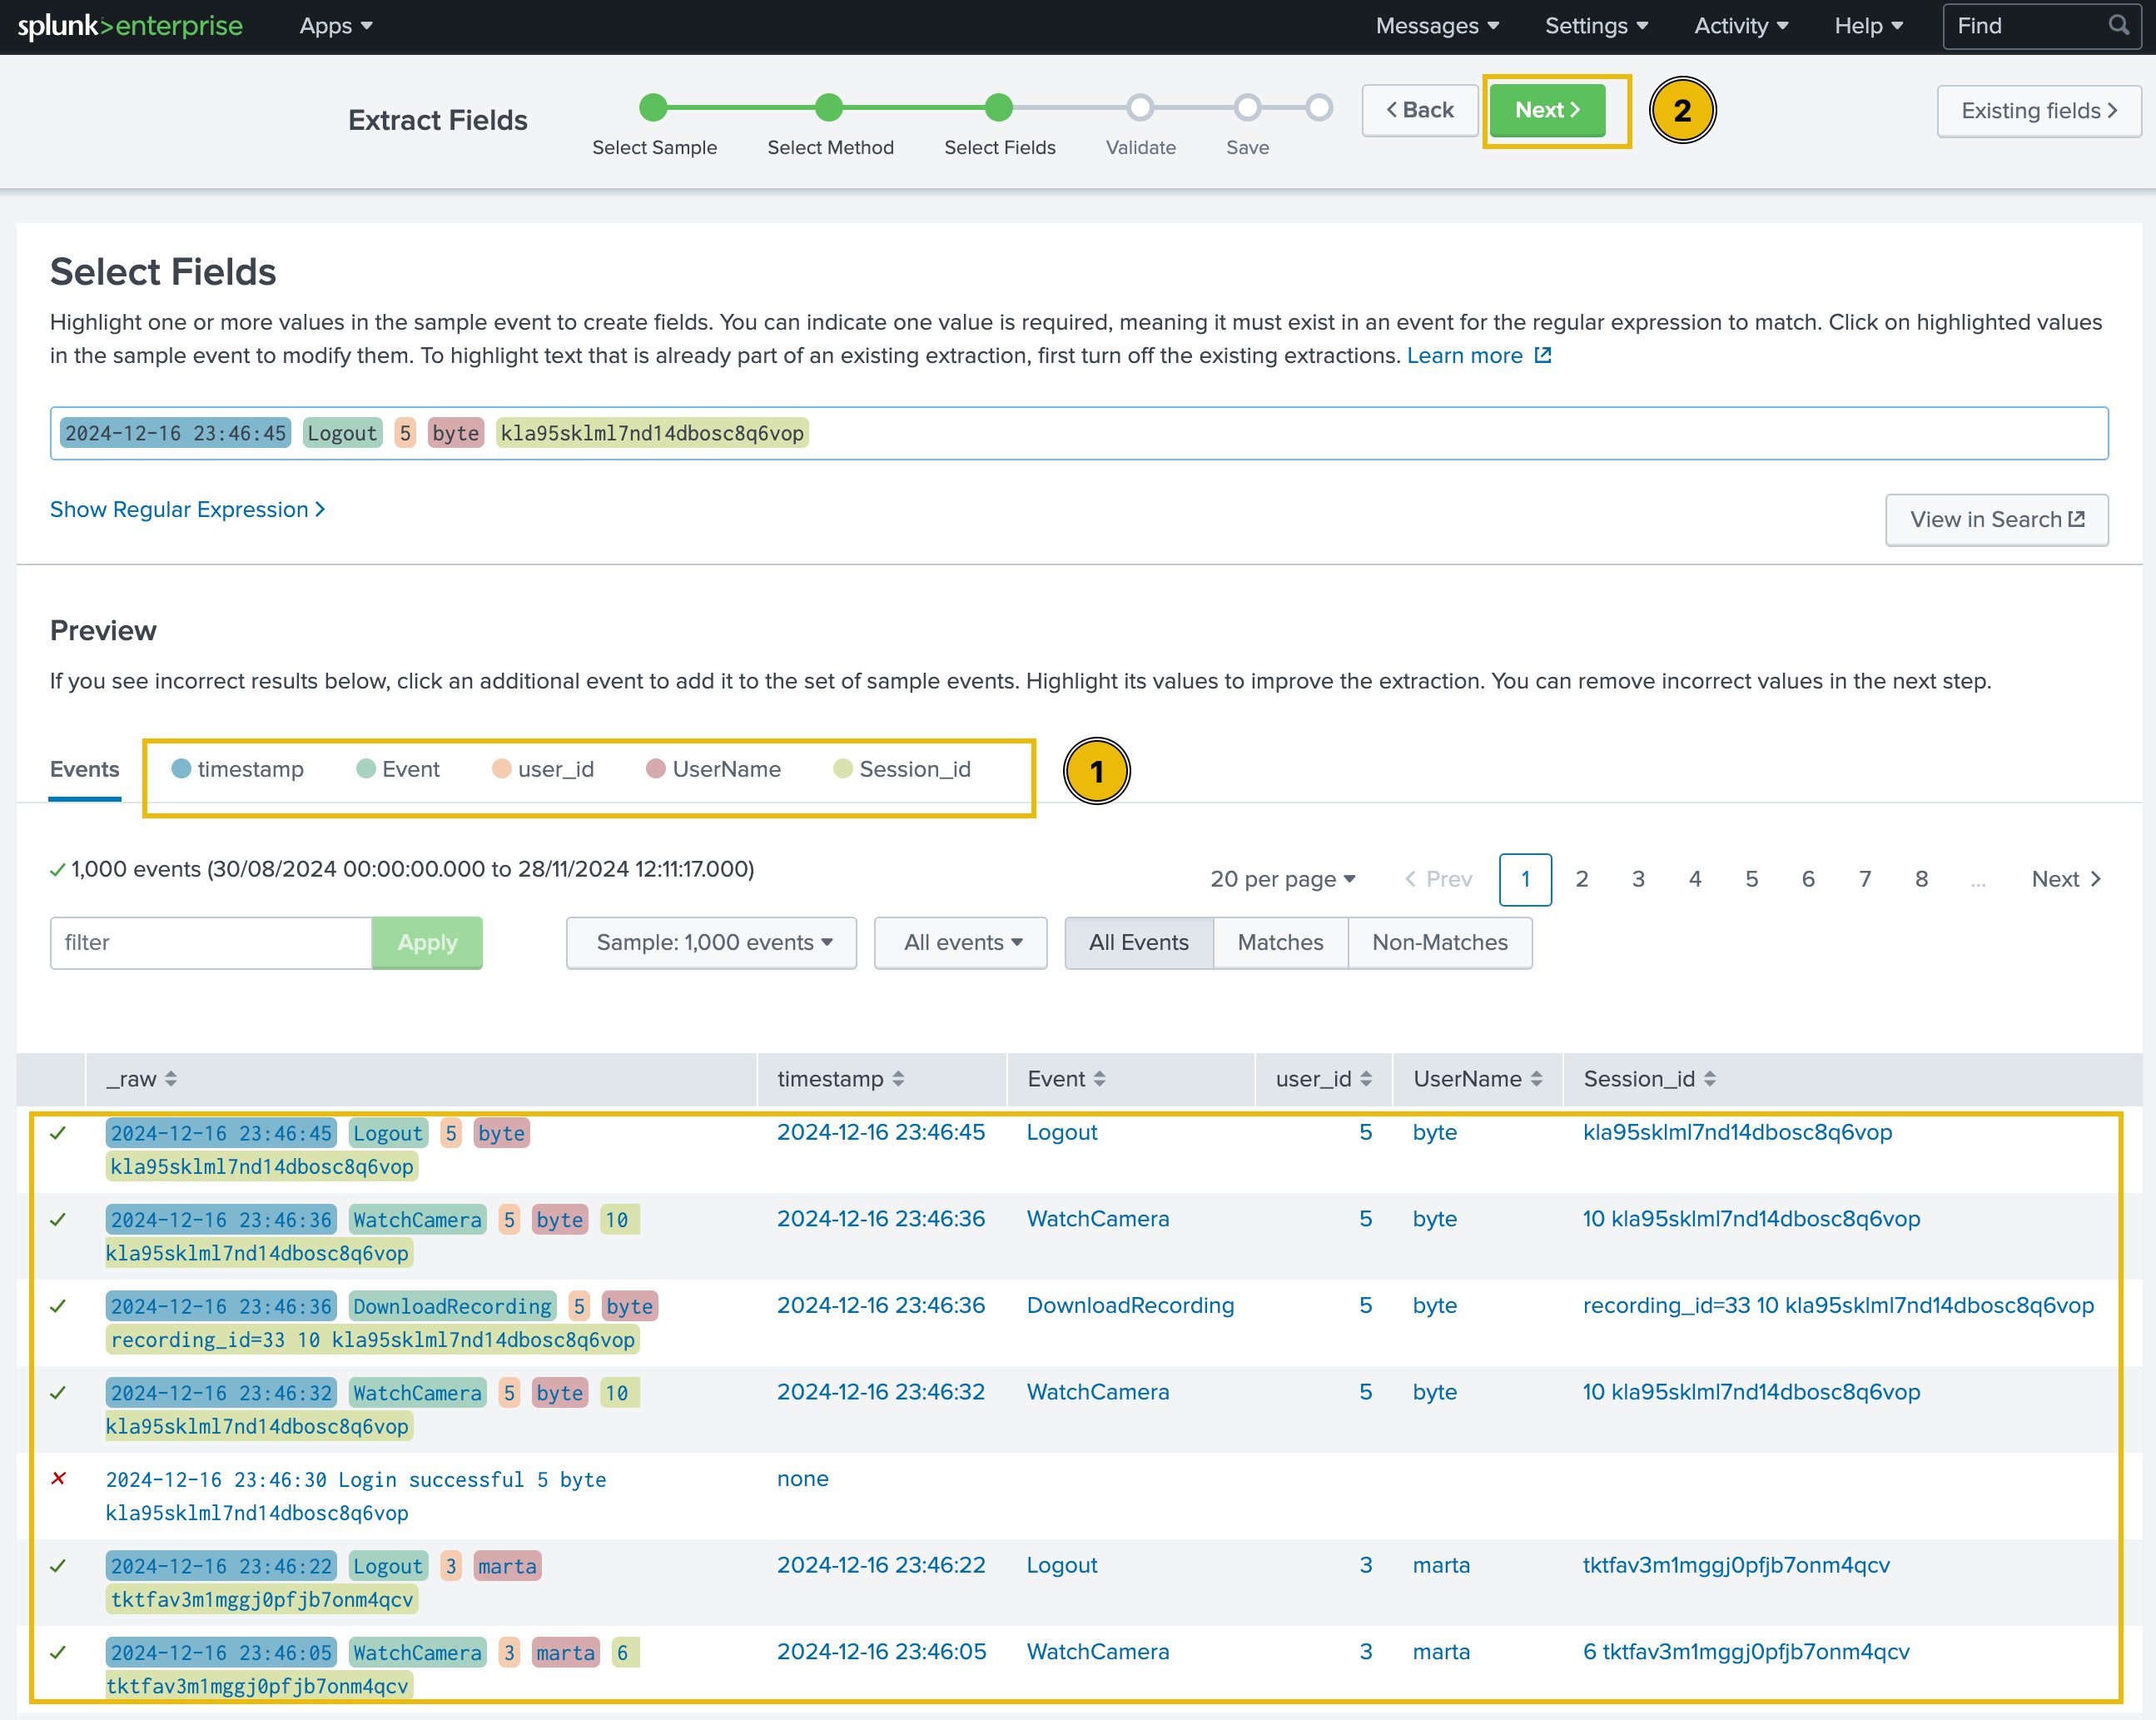
Now, to select the fields in the logs that we want to extract, we simply need to highlight them in the sample log. Splunk will autogenerate the regex (regular expression) to extract the selected field.
We’ll assign an appropriate name to each of the extracted fields based on the table below:
| Timestamp | Event | User_id | UserName | Session_id |
|---|---|---|---|---|
| 2024-12-16 17:20:01 | Logout | 5 | byte | kla95sklml7nd14dbosc8q6vop |
As evident from the preview section, by selecting the fields, Splunk creates a regular expression to extract that field from all the events.
All the extracted fields will be displayed in the Preview tab, as shown below:
It is important to note that some of the logs may have a different format, and they may not be parsed using the parser we created above. We may have to re-extract the fields from those events. We will get back to fixing this issue later.
We can click on each extracted field to check the extracted values. When we’re satisfied with the extracted values, we can click on the green Next button at the top of the page.
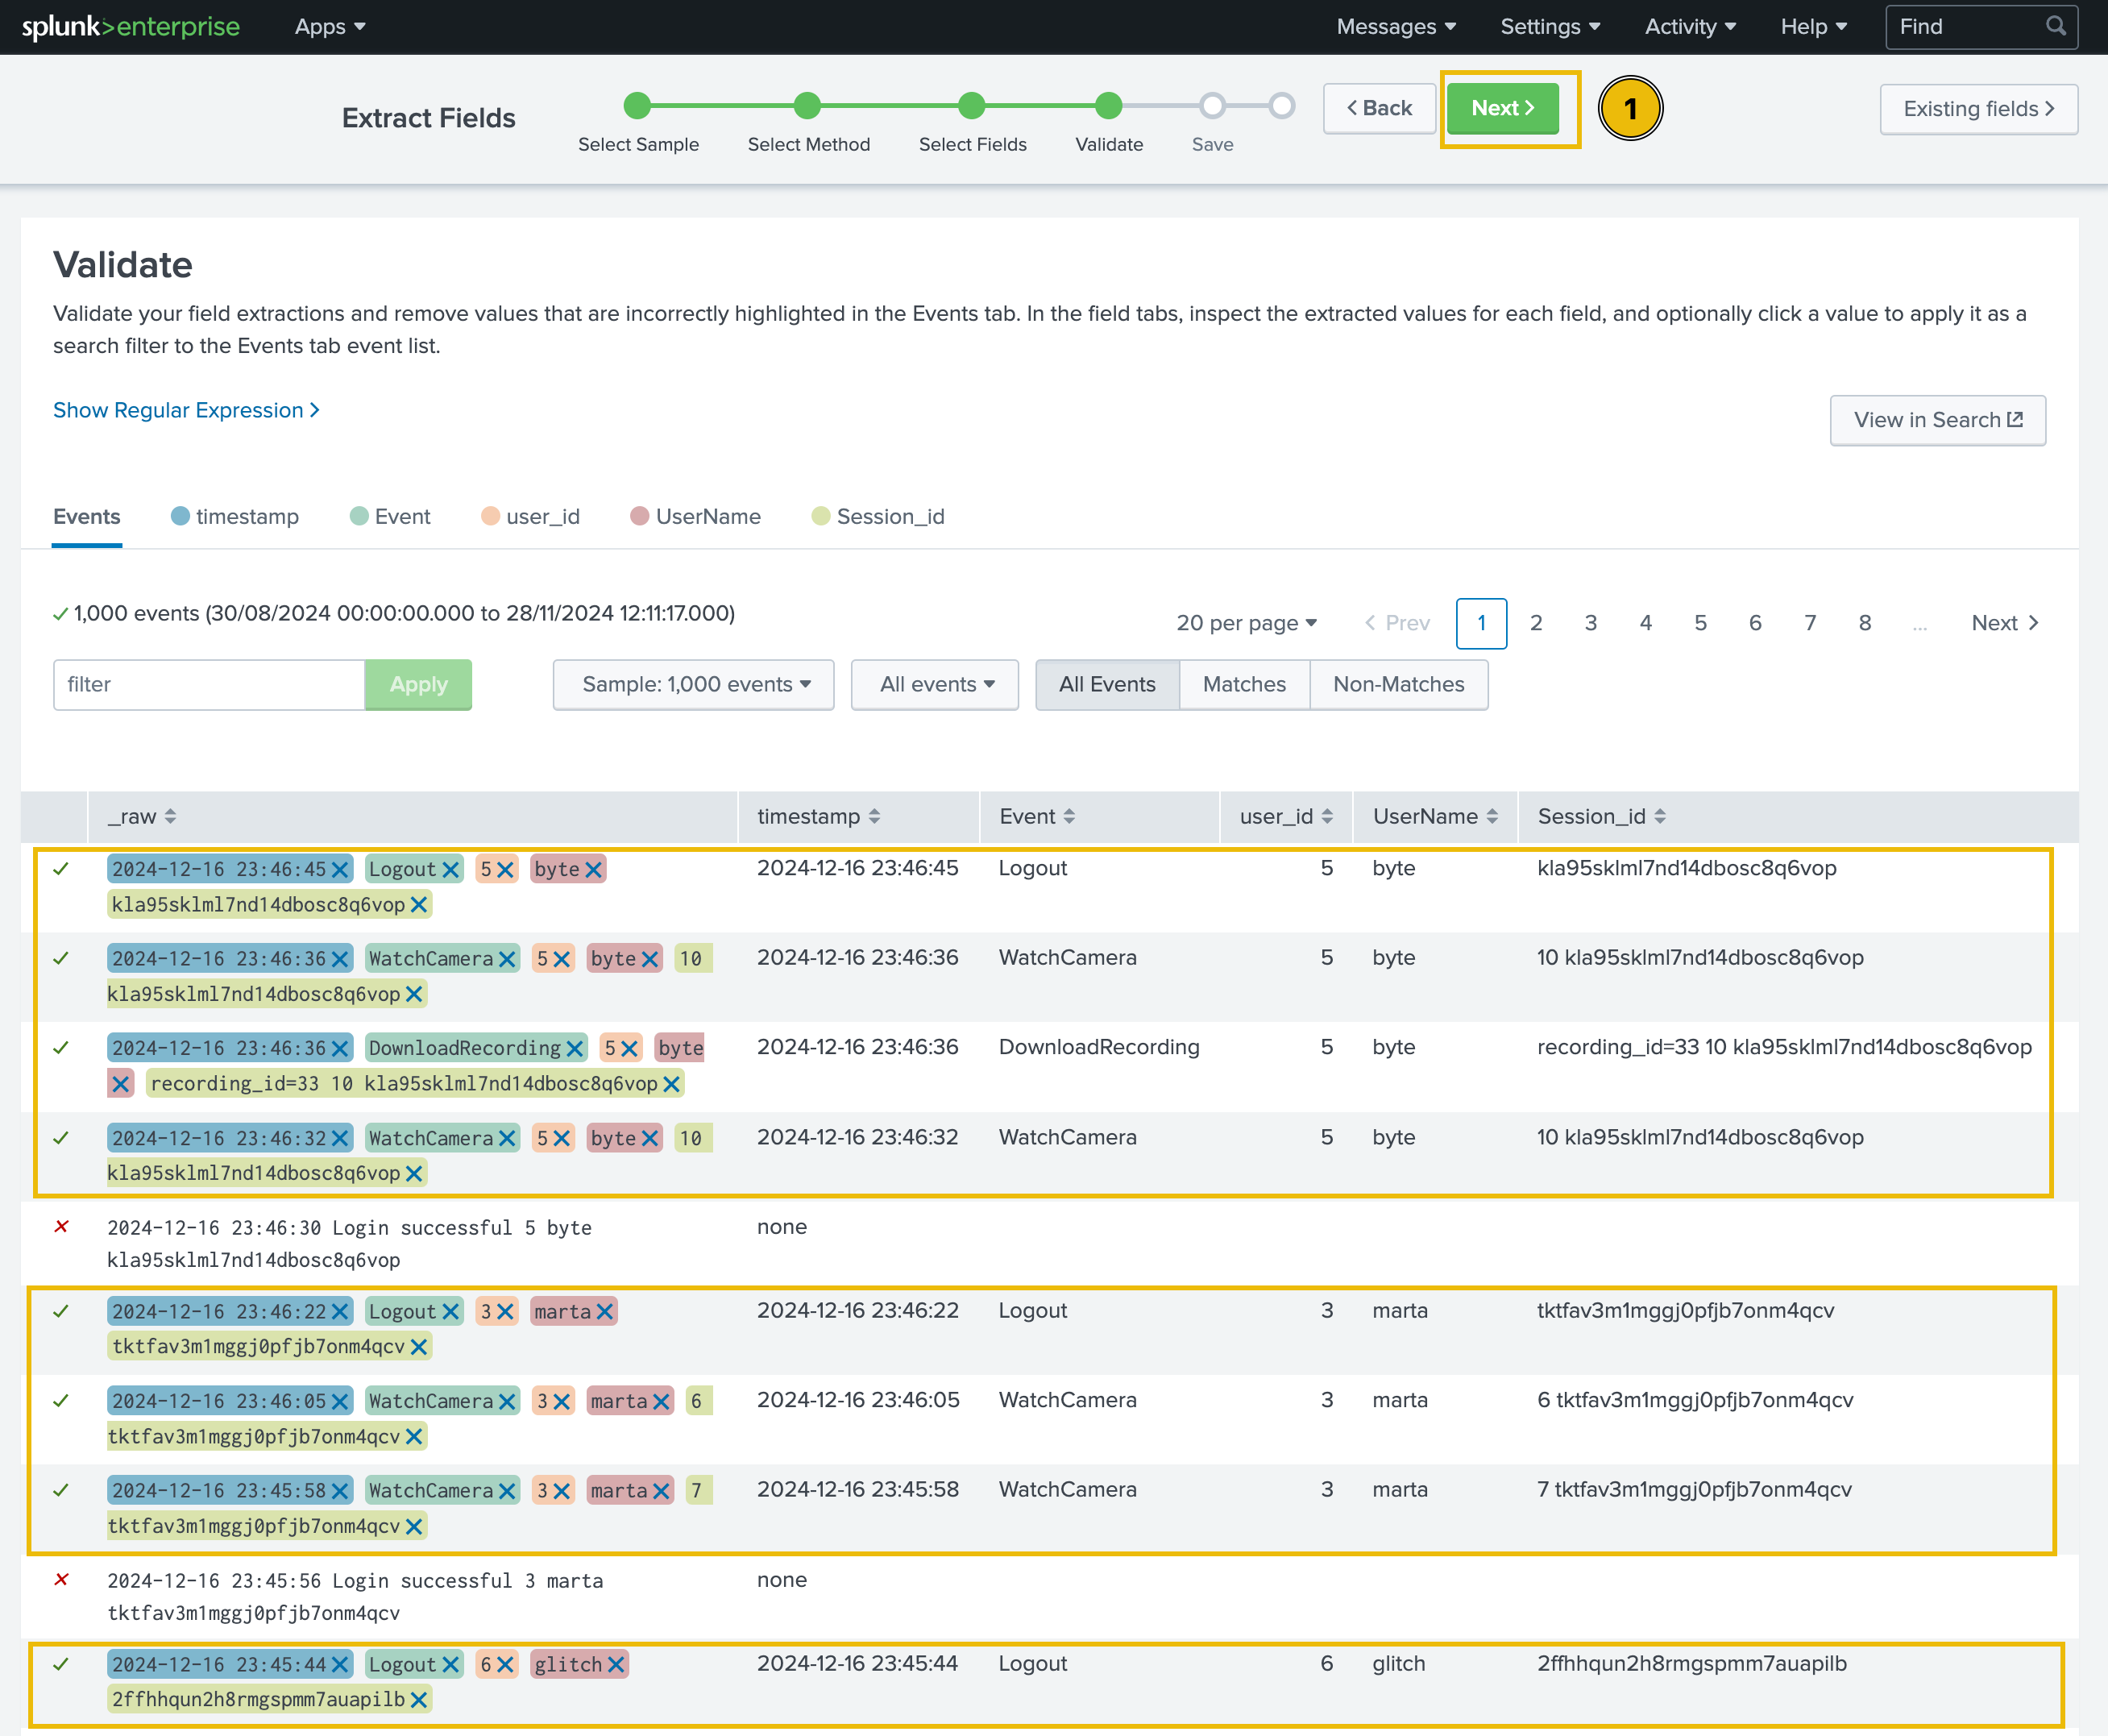
Validate
In the next step, we will see a green tick mark next to the sample logs to indicate the correct extraction of the fields, or a red cross sign to signal an incorrect pattern, as shown below:
Save and Analyse
After validating that the extracted fields are correct, the next step is saving and analysing the logs.
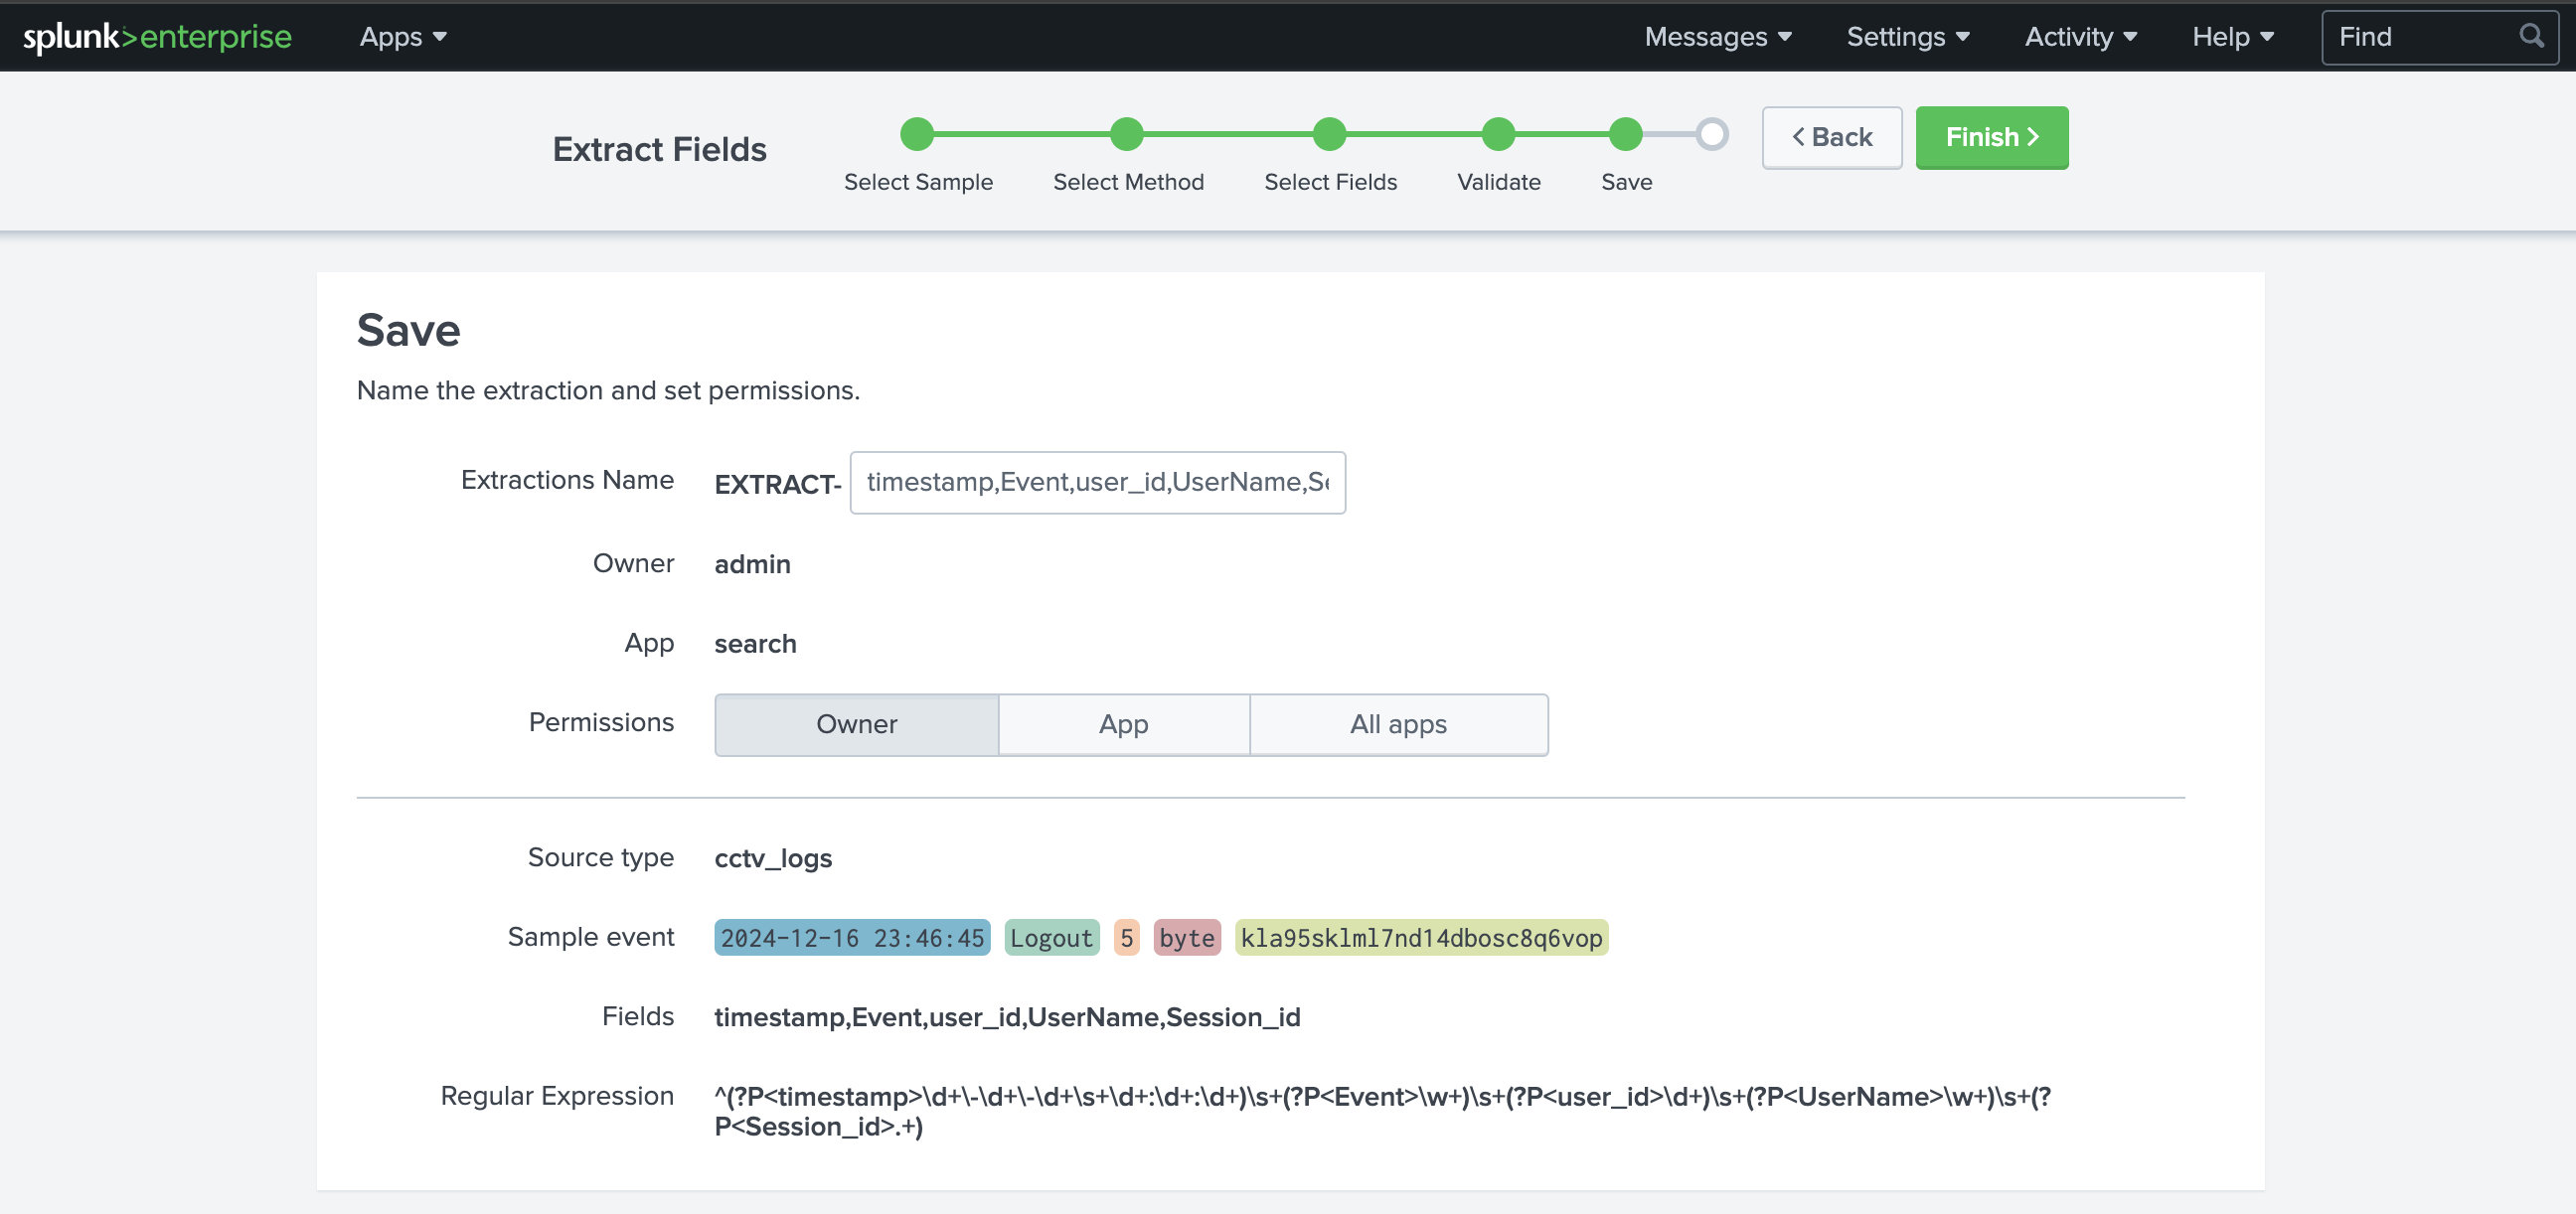
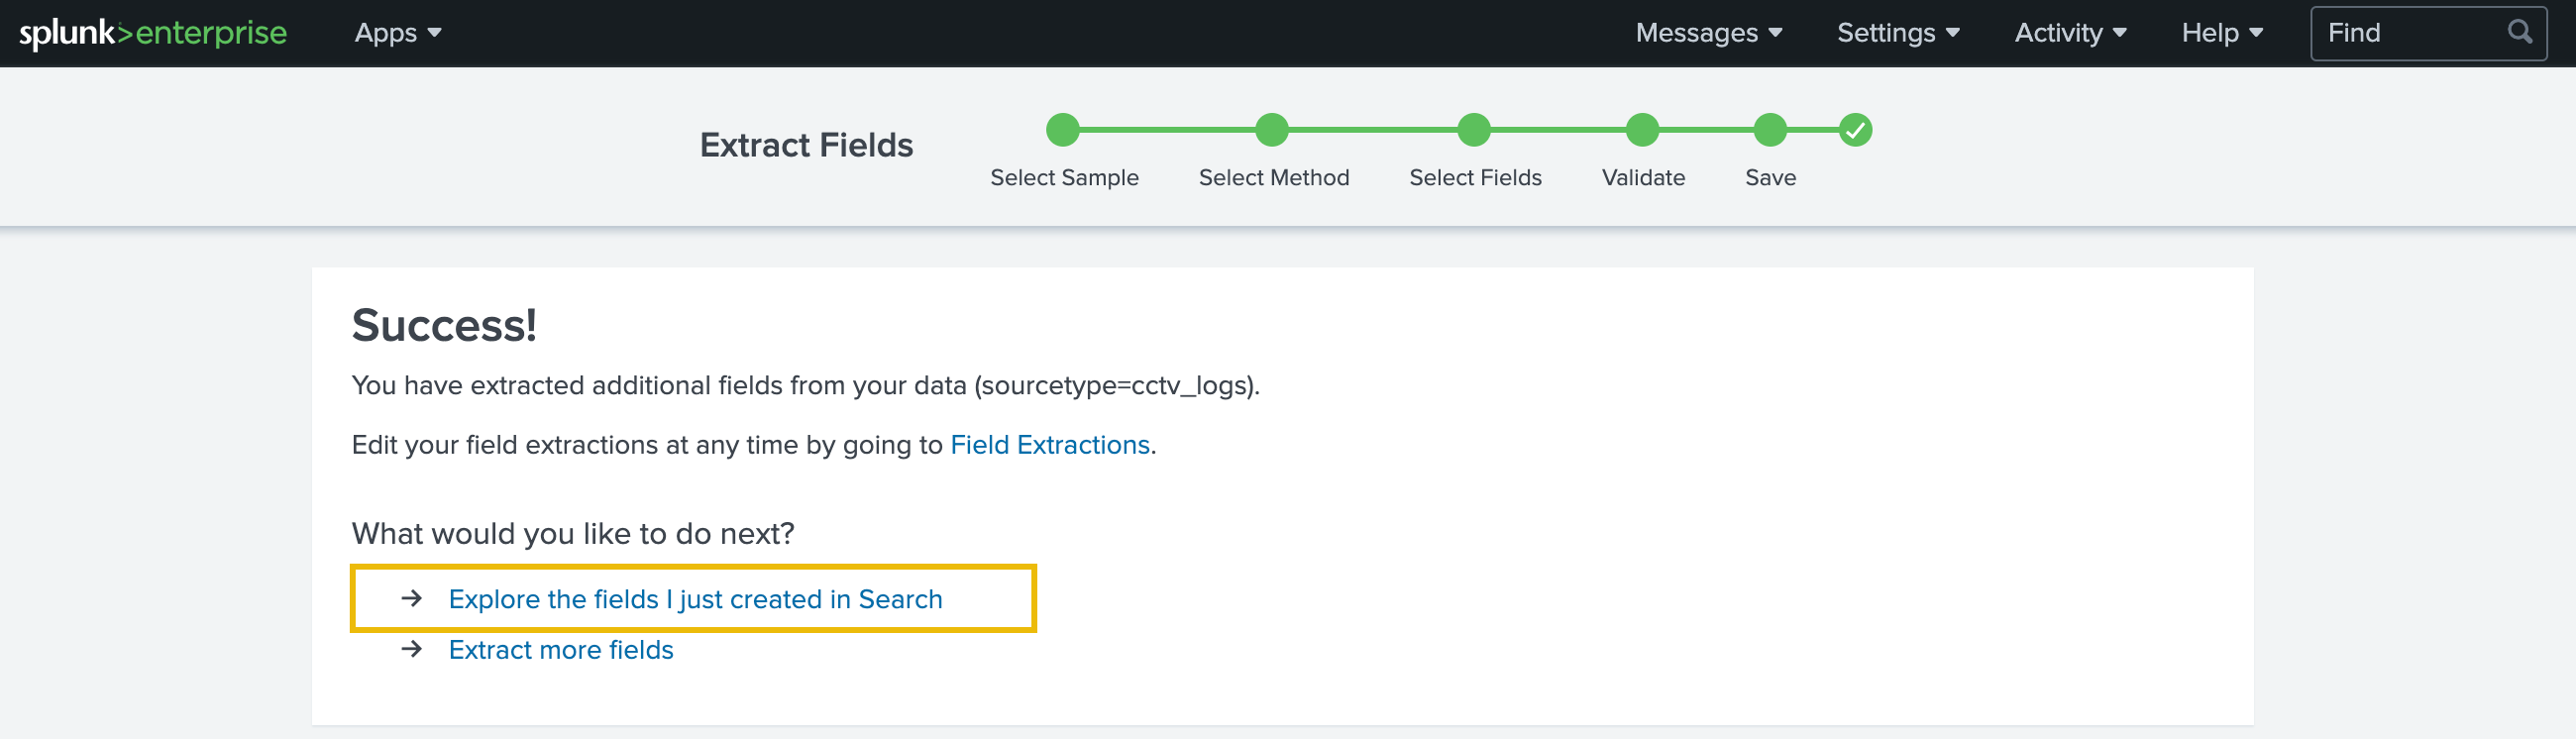
This tab shows us the regular expression created, the fields extracted, and the sample event that contains the fields we wanted to extract. Let’s save this session by clicking on the green Finish button at the top of the page and move on to the search tab to search the logs. To do so, we can click on the Explore the fields I just created in Search link on the next page.
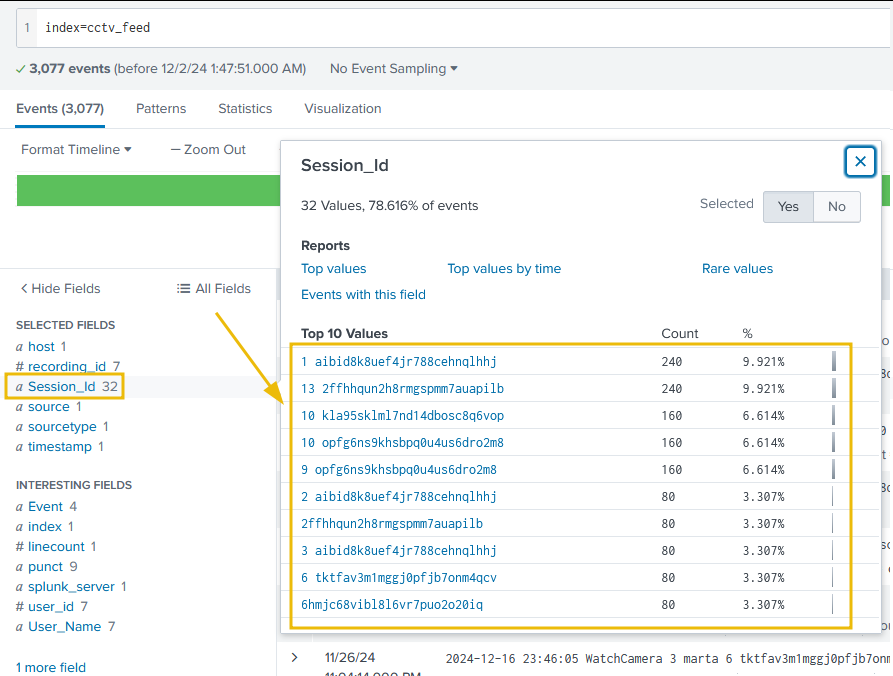
We can verify that we successfully extracted the custom fields from the logs by clicking on any of our custom fields in the list on the left of the page. For example, if we click on the UserName field, we’ll be presented with all the different values that have been extracted from the logs for this field.
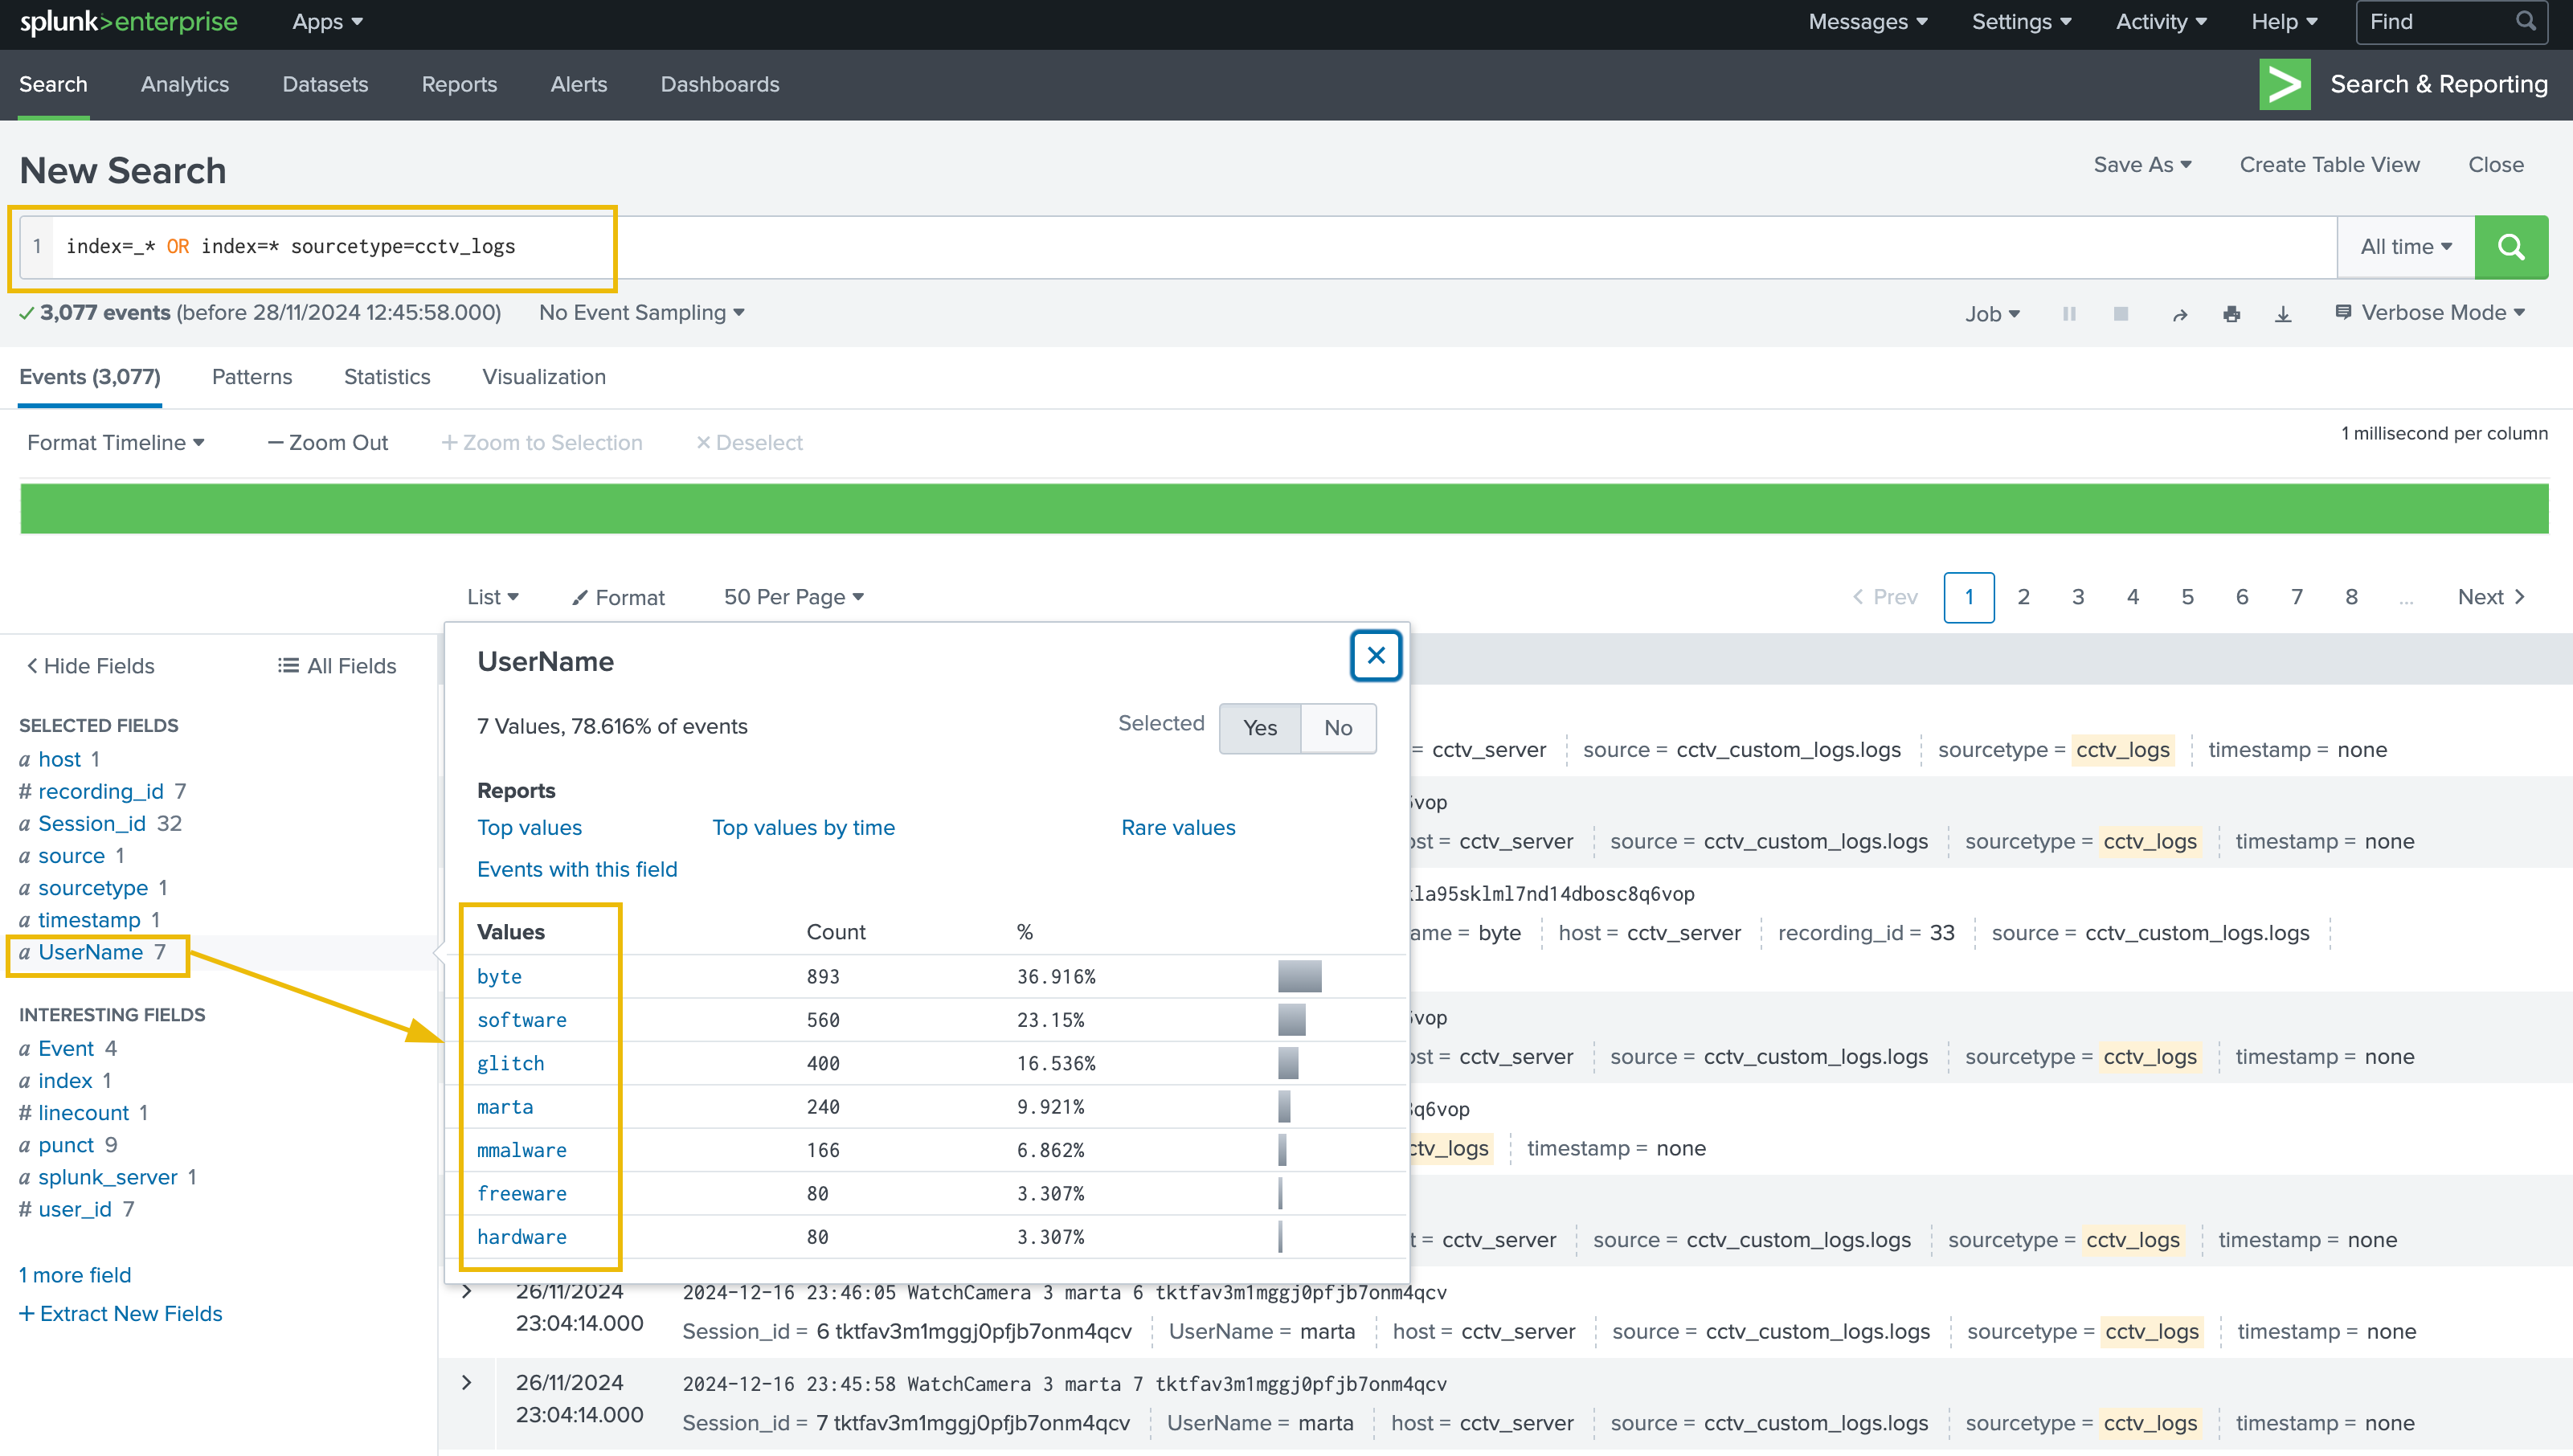
It also appears that some fields have not been parsed exactly as we expected:
Improving the Field Extraction
As previously mentioned, some of the logs are a bit different from the ones we used as a baseline for the field extraction. Some of the log formats that our parser could not pick are mentioned below:
| Sample Log | 2024-12-16 23:45:56 Login successful 3 marta tktfav3m1mggj0pfjb7onm4qcv |
|---|---|
| Sample Log | 2024-12-16 22:47:12 Login failed glitch pass=ImtheB3st! rij5uu4gt204q0d3eb7jj86okt |
It is important to note that, there can be various ways to achieving our goal of fixing the parser. We will try of of the methods, as covered in steps below:
Removing the Fields Extraction
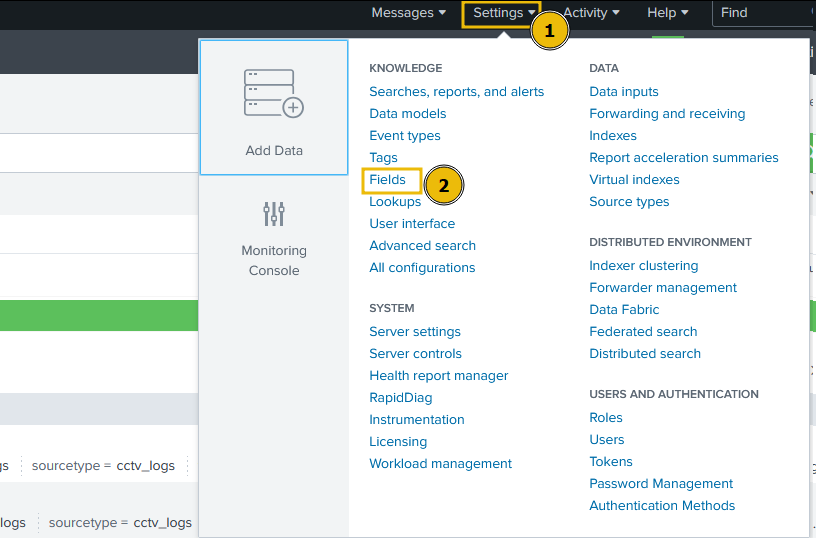
Let’s go to Settings -> Fields, as shown below:
Field Extraction
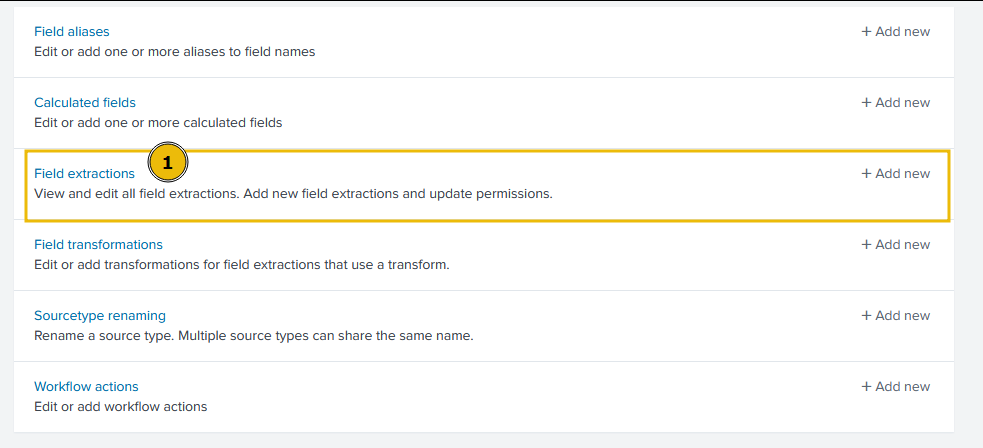
Click on the Field extractions tab; it will display all the fields extracted.
Delete the Regex Pattern
This tab will display all the patterns/fields extracted so far in Splunk. We can look for the cctv related pattern in the list, or simply search cctv in the search bar, and it will display our recently created pattern. Once the right pattern is selected, click on the Delete button, as shown below.
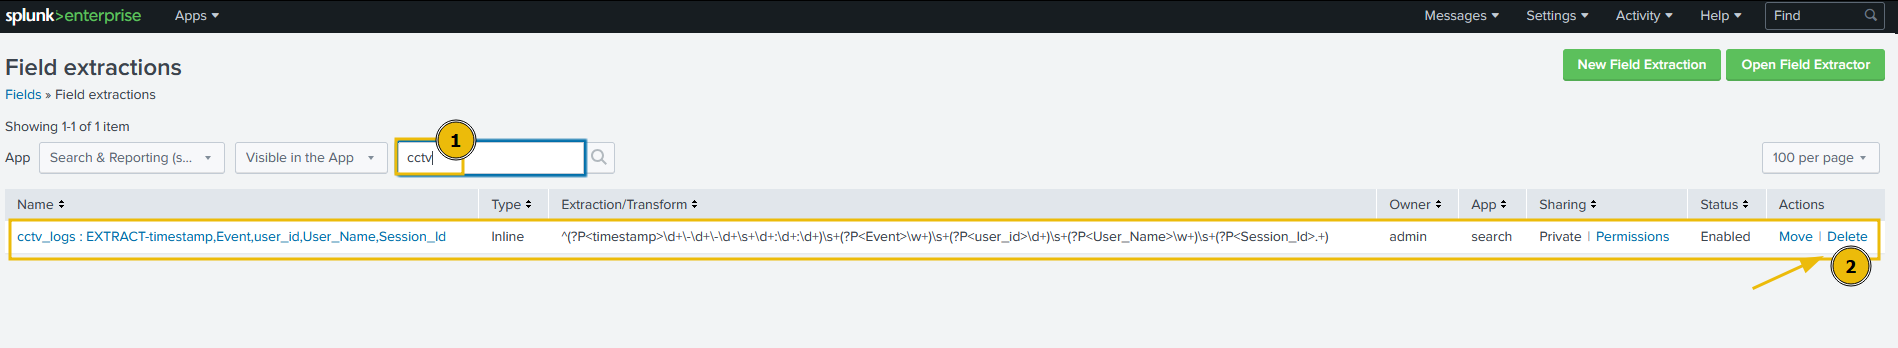
Why we are deleting this previously created pattern? Well, this regex picks fields from some logs and leave behind other logs, which may be vital for our investigation. Our goal is to create one generic regular expression, that works on almost all events.
Open Filed Extractor
Next, click on the Open Field Extractor button, and it will take us to the same tab, where we can extract the fields again.
Update the Regex
This time, after selecting the right source type as cctv_logs, and time range as All Time, click on I prefer to write the regular expression myself.
In the next tab, enter the regex :
^(?P<timestamp>\d+\-\d+\-\d+\s+\d+:\d+:\d+)\s+(?P<Event>(Login\s\w+|\w+))\s+(?P<user_id>\d+)?\s?(?P<UserName>\w+)\s+.*?(?P<Session_id>\w+)$
And select Preview.
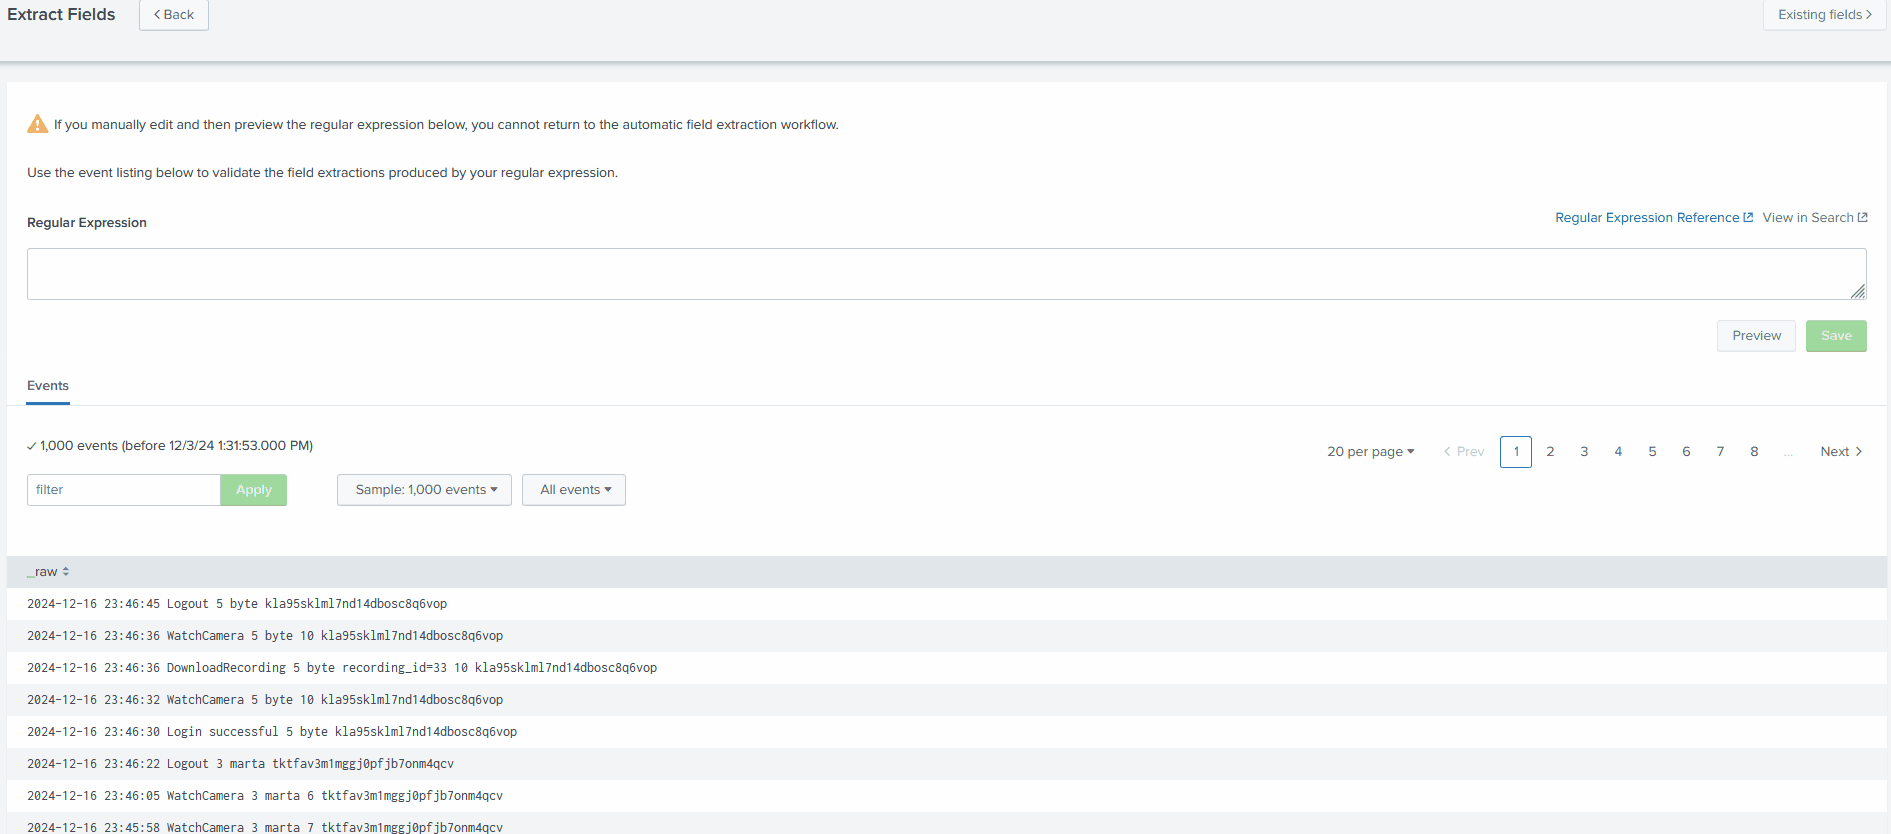
This regex will fix the field parsing pattern and extract all needed fields from the logs. Hit Save and on the next page, select Finish.
On the next page, once again, click on the Explore the fields I just created in Search.
Now that we can observe that all fields are being extracted as we wanted, let’s start investigating the logs.
Investigating the CCTV Footage Logs

Now that we have sanitized and properly parsed the logs, it’s time to examine them and find the culprit.
Summary of the CCTV Feed
After examining the CCTV feed logs, we can create a mental picture of the information these logs provide us. A brief summary of these logs is:
- These logs contain the successful and failed login attempts from various users.
- They contain a few failed login attempts, which looks suspicious.
- They contain information about the CCTV footage being watched and downloaded.
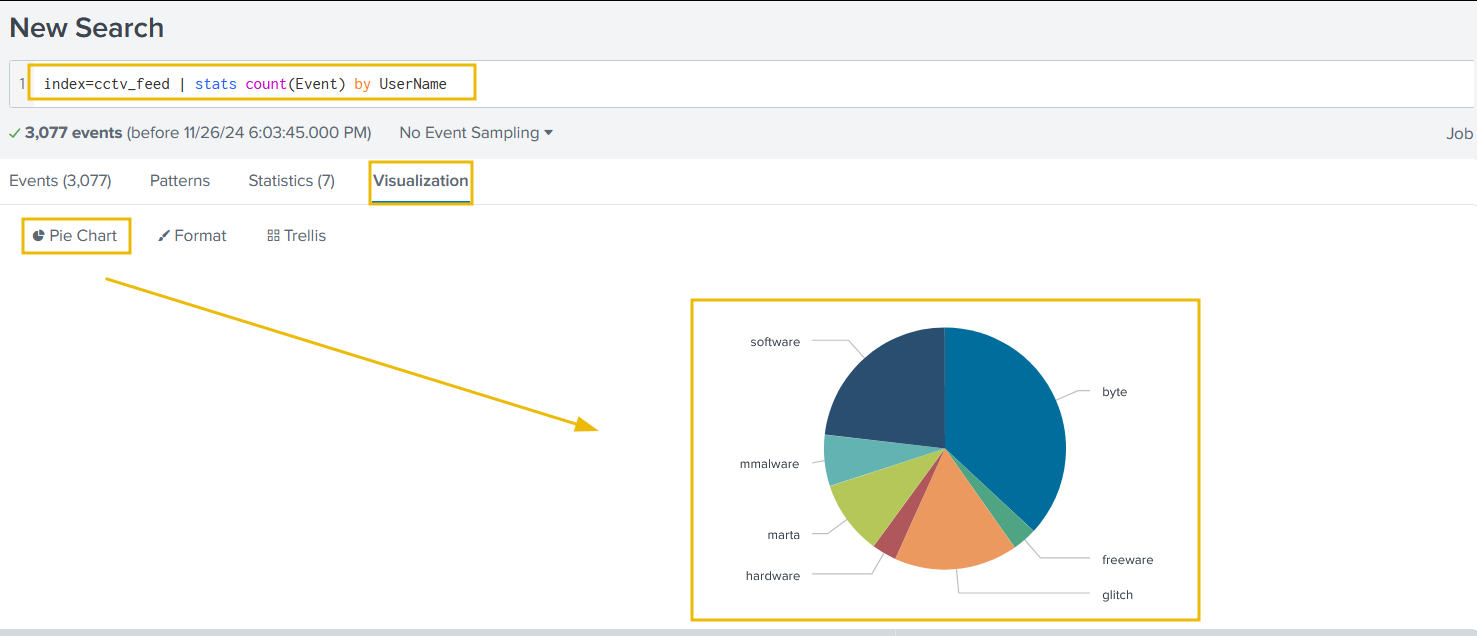
Event Count by Each User
Let’s use the following search query to see the count of events by each user:
index=cctv_feed | stats count(Event) by UserName
We can easily visualise this data by first clicking on Visualization below the search bar, then change the visualisation type from Bar Chart to Pie Chart.
Summary of the Event Count
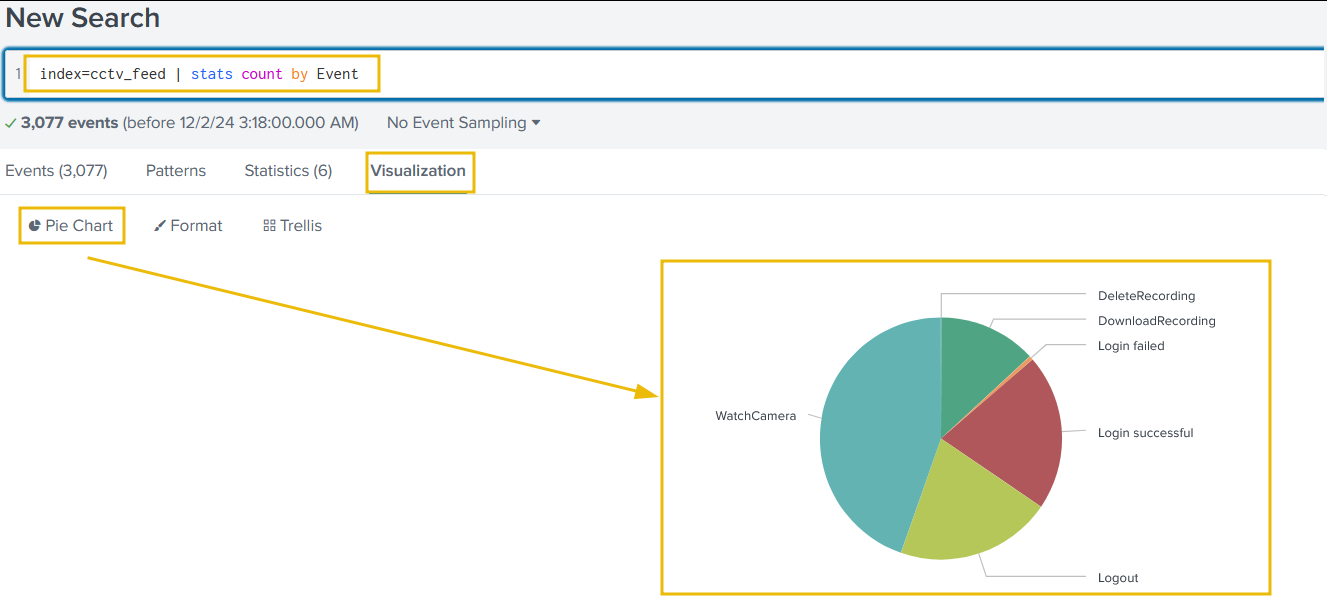
We can create a summary of the event count to see what activities were captured in the logs using the following query:
index=cctv_feed | stats count by Event
Splunk will automatically display the previously selected Pie Chart type of visualisation.
Examining Rare Events
Using the following search query, let’s look at the events with fewer occurrences in the event field to see if we can find something interesting:
index=cctv_feed | rare Event
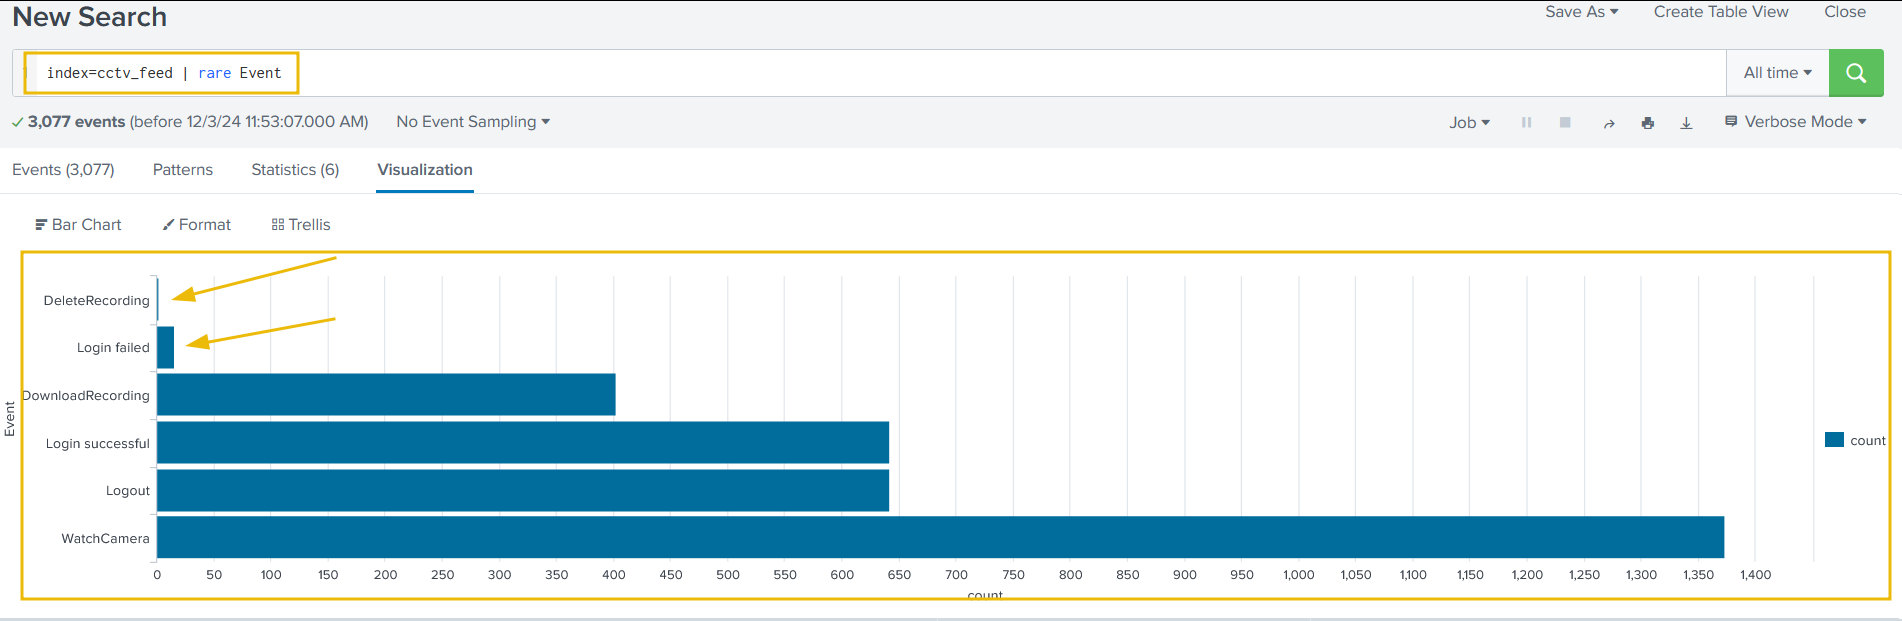
It looks like we have a few attempts to delete the recording and a few failed login attempts. This means we have a clue. Let’s now examine the failed login attempts first:
1
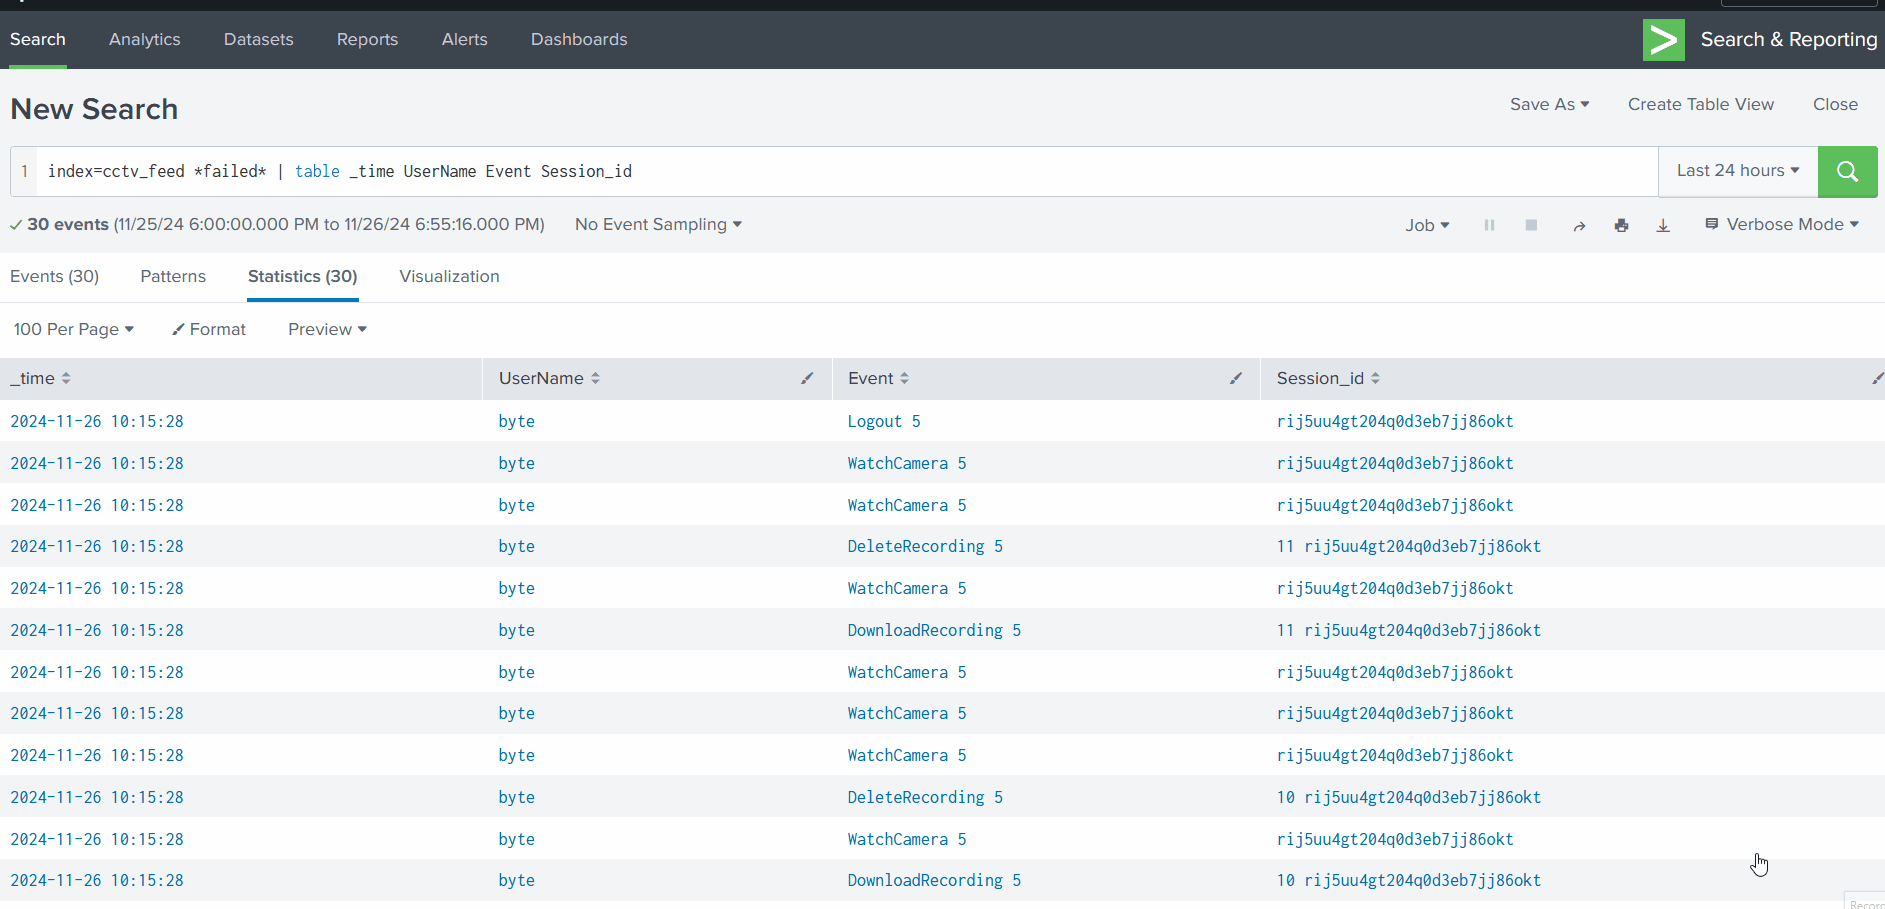
index=cctv_feed *failed* | table _time UserName Event Session_id
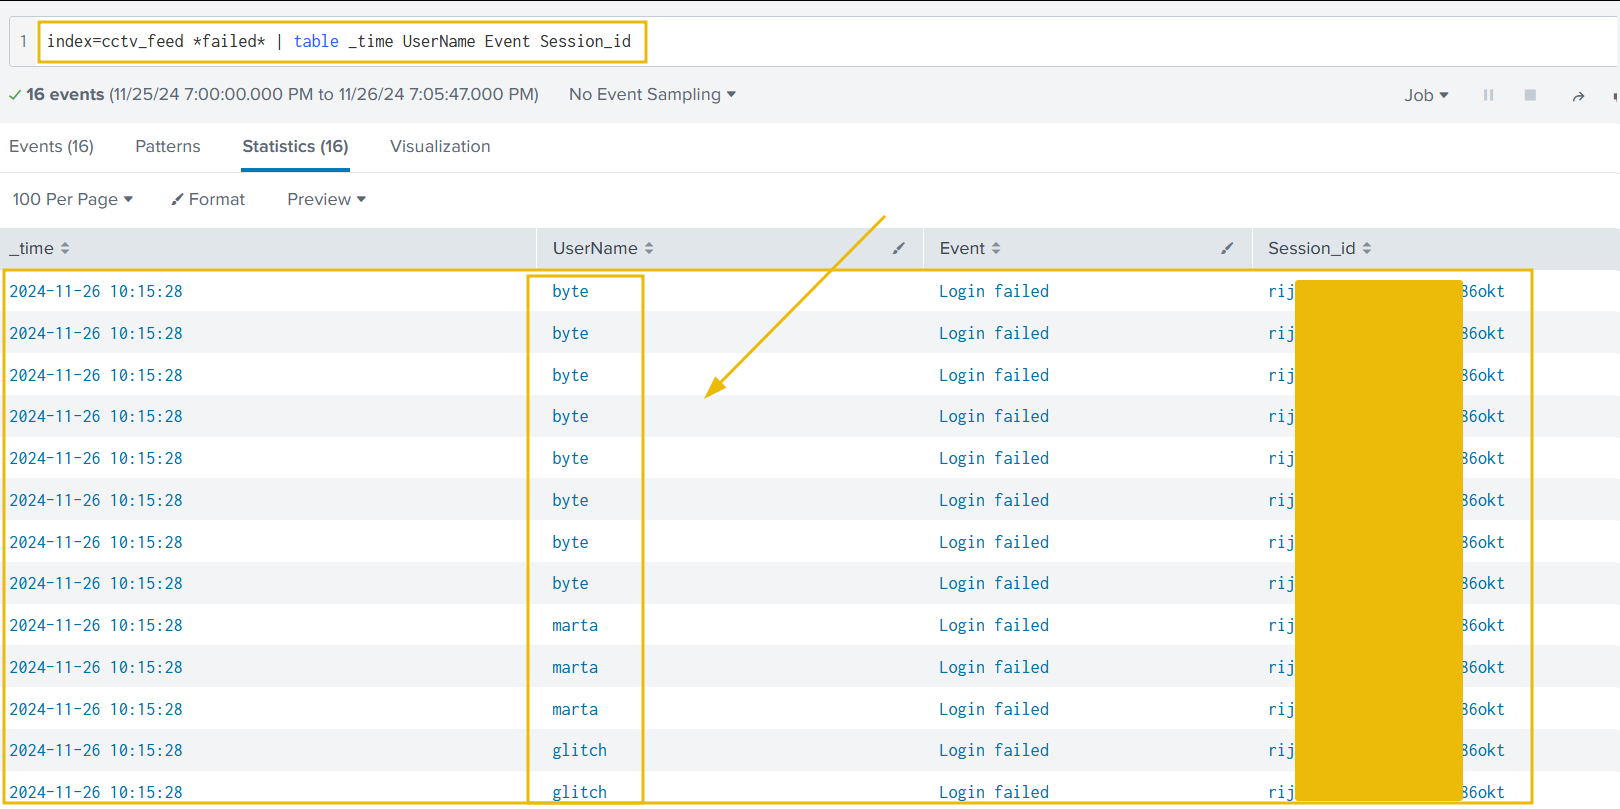
We found some failed login attempts against four users, but one thing remains constant: the Session_id.
Narrowing Down Our Investigation
Let’s narrow down our results to see what other events are associated with this Session_id:
1
index=cctv_feed *put_Session_id_here* | table _time UserName Event Session_id
Let’s see how many events related to the deletion of the CCTV footage were captured.
1
index=cctv_feed *Delete*
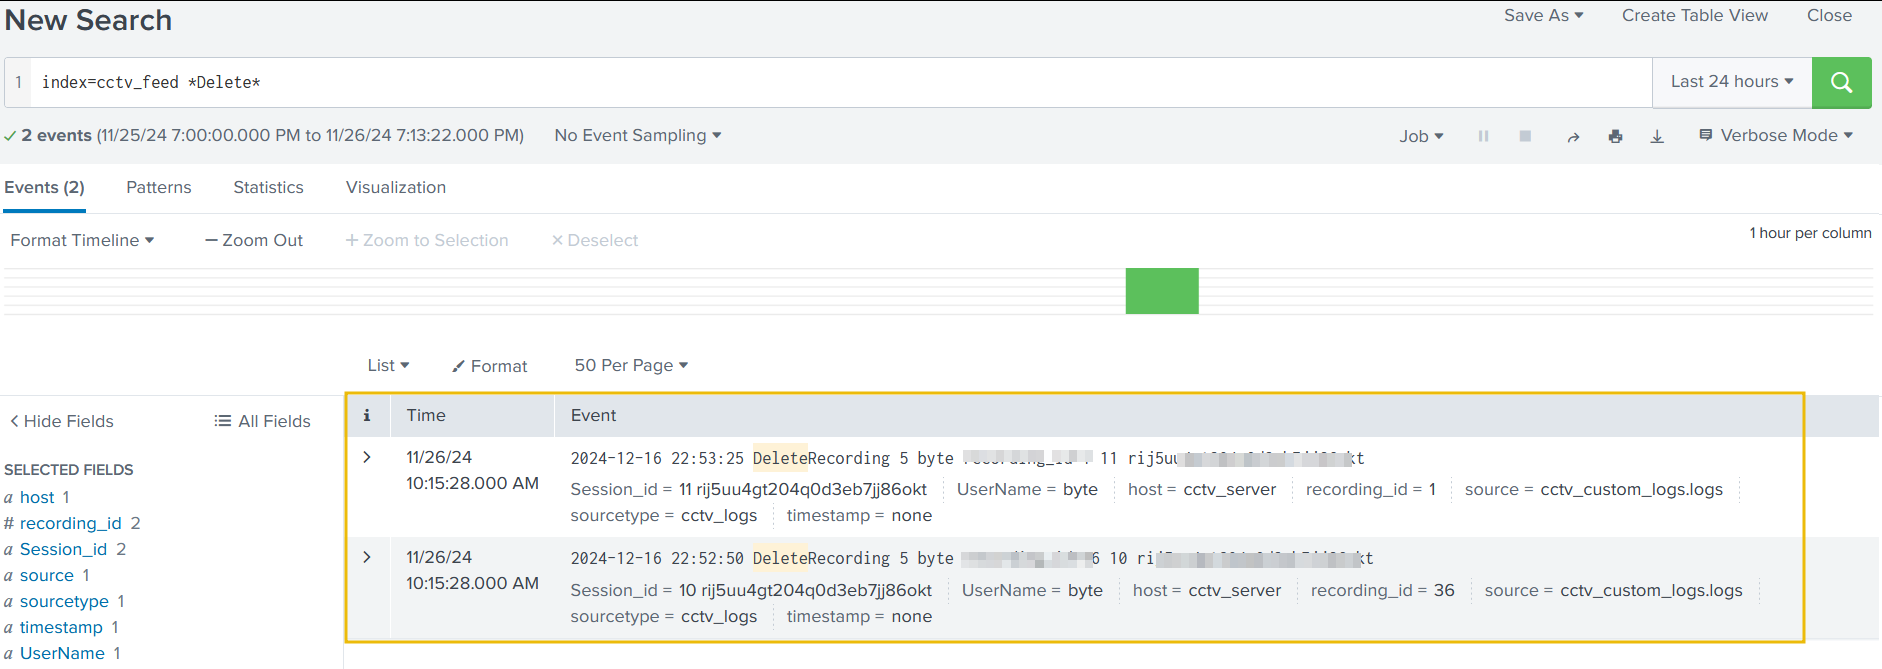
Good. We have some comprehensive information about the attacker and his notorious activities.
Correlating With the Web Logs
Let’s use the information extracted from the earlier investigation and correlate it with the web logs.
Suspicious IP Address
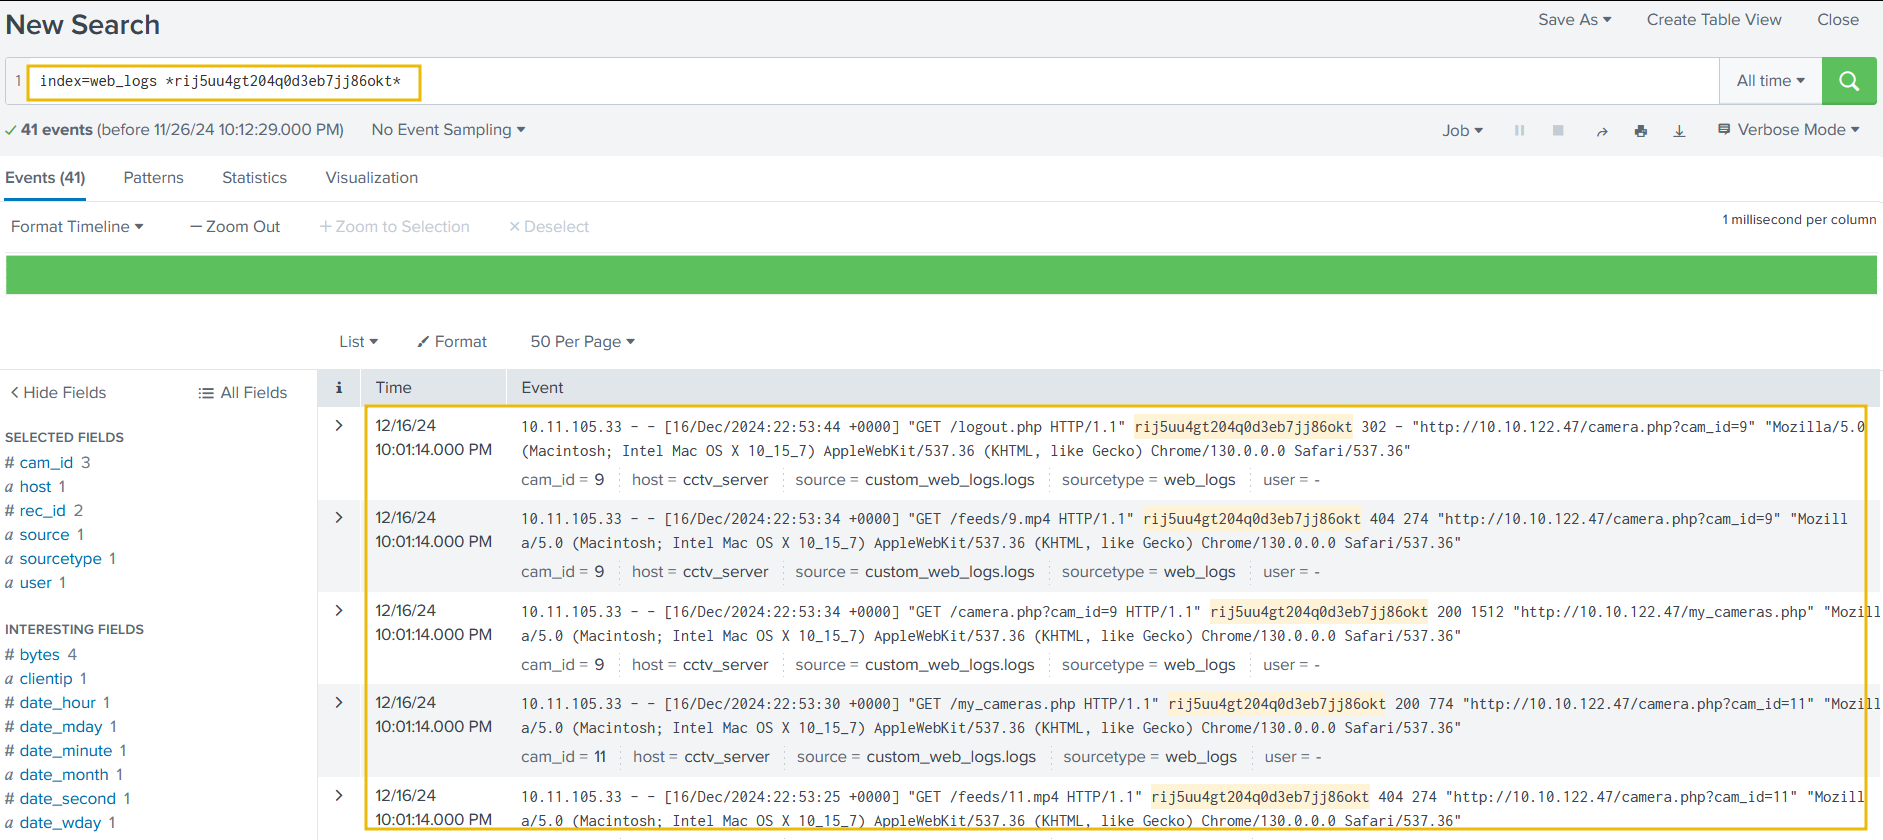
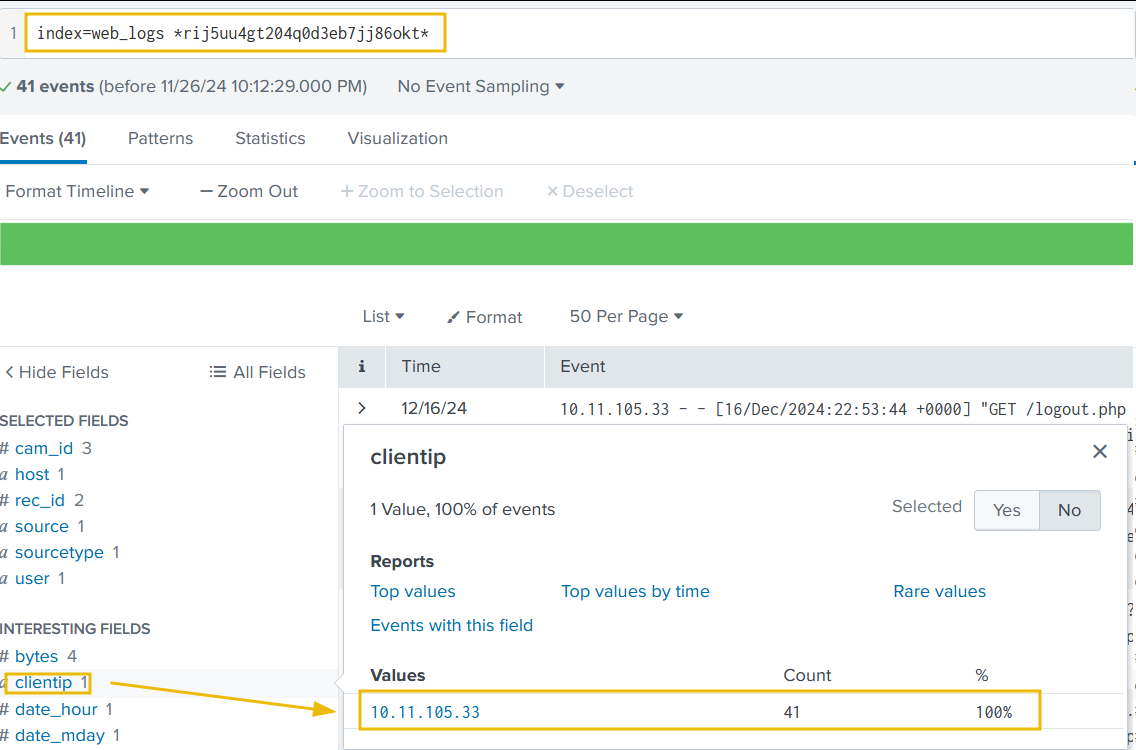
During the examination, it is observed that only one IP address 10.11.105.33 is associated with the suspicious session ID.
Identify the footprint associated with the session ID.
1
index=web_logs *rij5uu4gt204q0d3eb7jj86okt*
Let’s narrow down the search to show results associated with the IP address found earlier. It is also important to note that, in this case, the details about the session IDs are found in the field status.
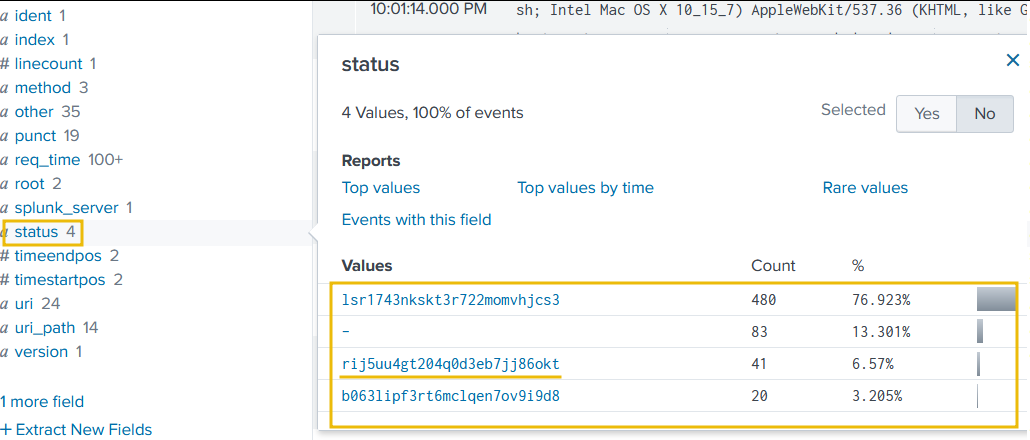
It looks like two more Session IDs were associated with the IP address found earlier. Let’s create a search to observe what kind of activities were captured associated with the IP and these session IDs.
1
index=web_logs clientip="10.11.105.33" | table _time clientip status uri ur_path file
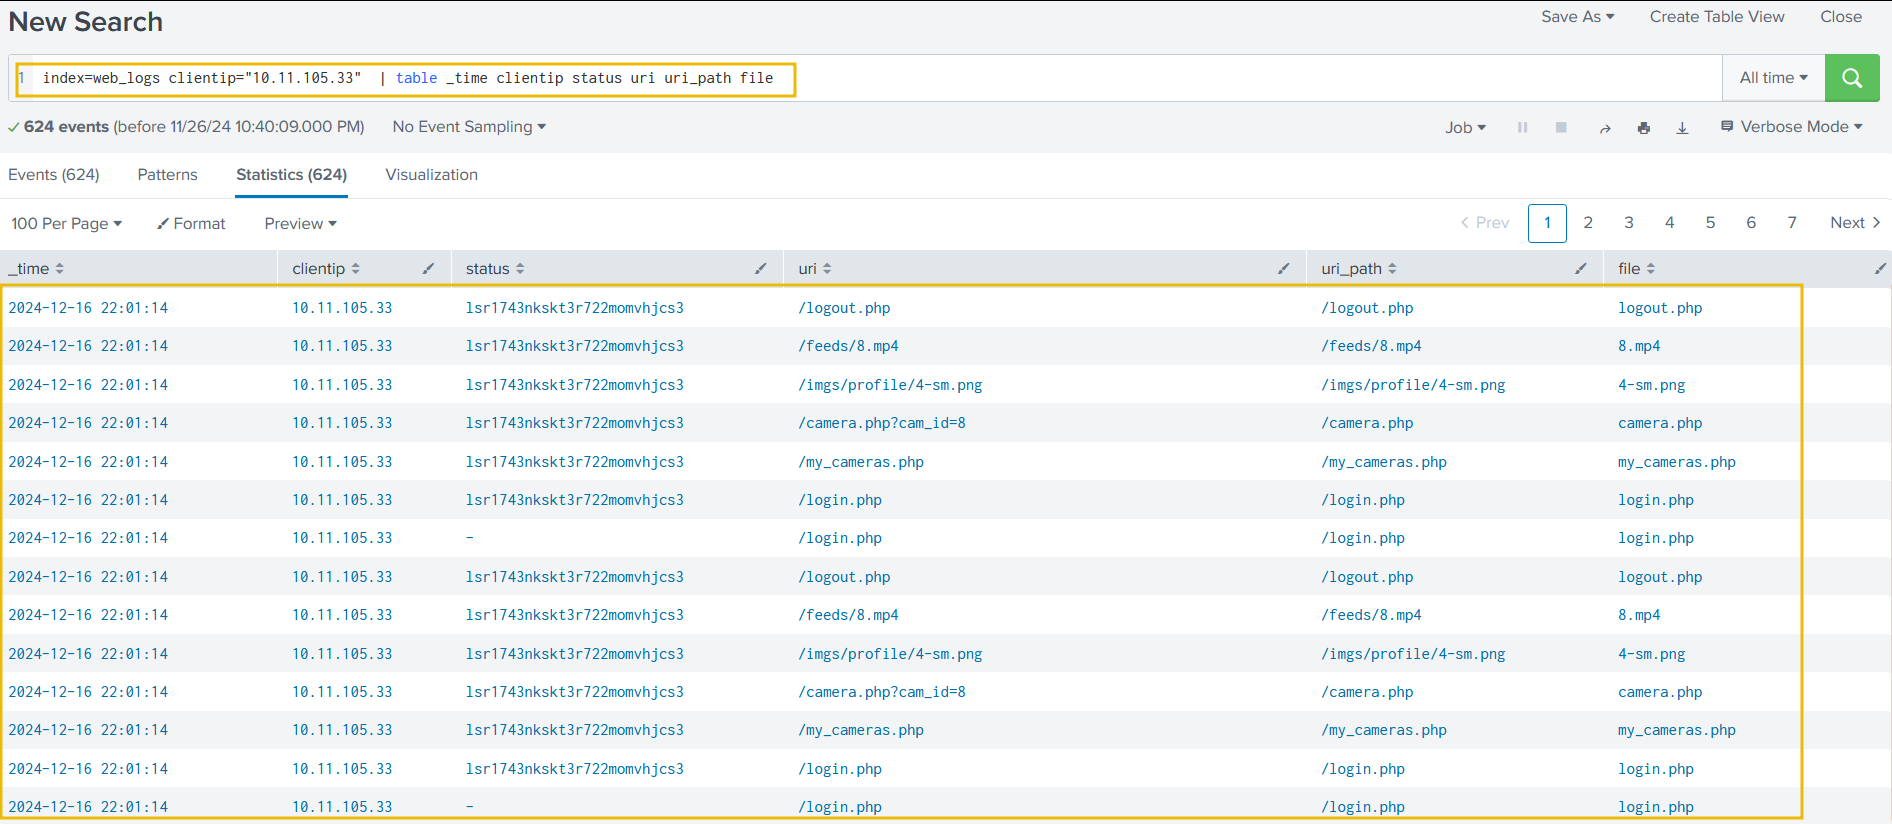
Looking closely, we can see logout events when the session ID was changed. Can we correlate these session IDs in the cctv_feeds logs and see if we can find any evidence?
Connecting the Dots
Let’s go back to cctv_feed and use these session IDs associated with the IP address, as shown below:
1
index=cctv_feed *lsr1743nkskt3r722momvhjcs3*
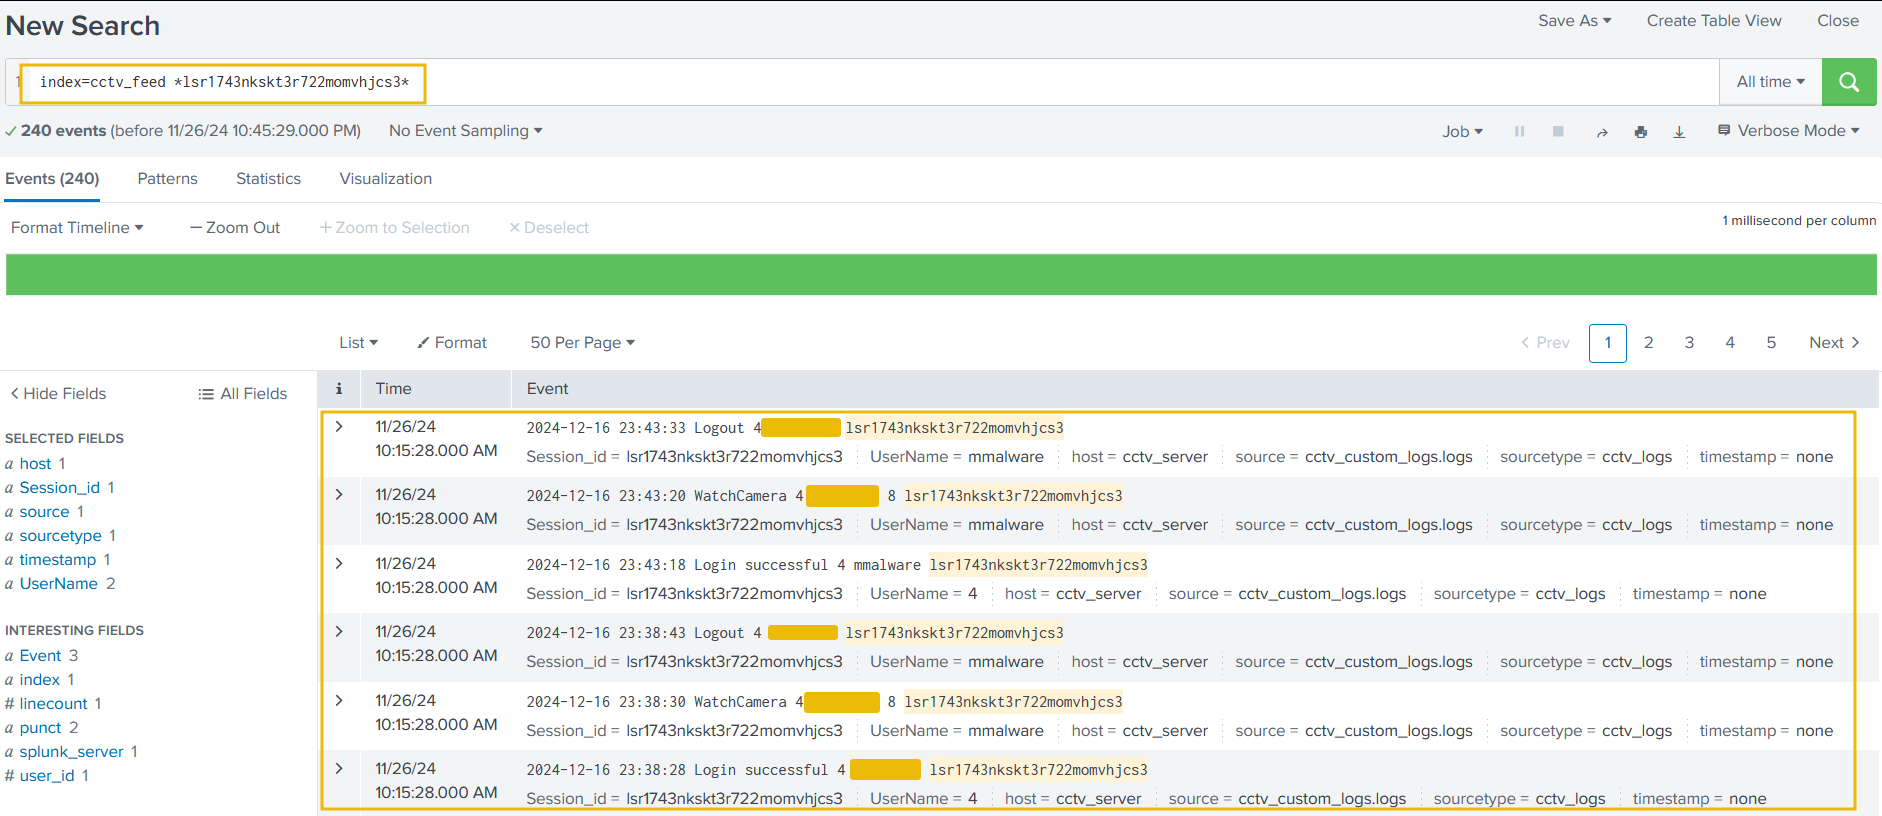
Great, we were able to locate the user name associated with the attack. Now that we have identified the user, let’s summarise our investigation.
From the output, it seems the following was the timeline of the attack:
- Attacker bruteforce attempt on various accounts.
- There was a successful login after the failed attempts.
- Attacker watched some of the camera streams.
- Multiple camera streams were downloaded.
- Followed by the deletion of the CCTV footage.
- The web logs had an IP address associated with the attacker’s session ID.
- We found two other session IDs associated with the IP address.
- We correlated back to the cctv_feed logs to find the traces of any evidence revolving around those session IDs, and found the name of the attacker.
Answer
Question 1
Extract all the events from the cctv_feed logs. How many logs were captured associated with the successful login?
Answer
Question 2
What is the Session_id associated with the attacker who deleted the recording?
Answer
Question 3
What is the name of the attacker found in the logs, who deleted the CCTV footage?